Chart your course
GRIB Files vs Marine Forecasts
Quick answer
The short version
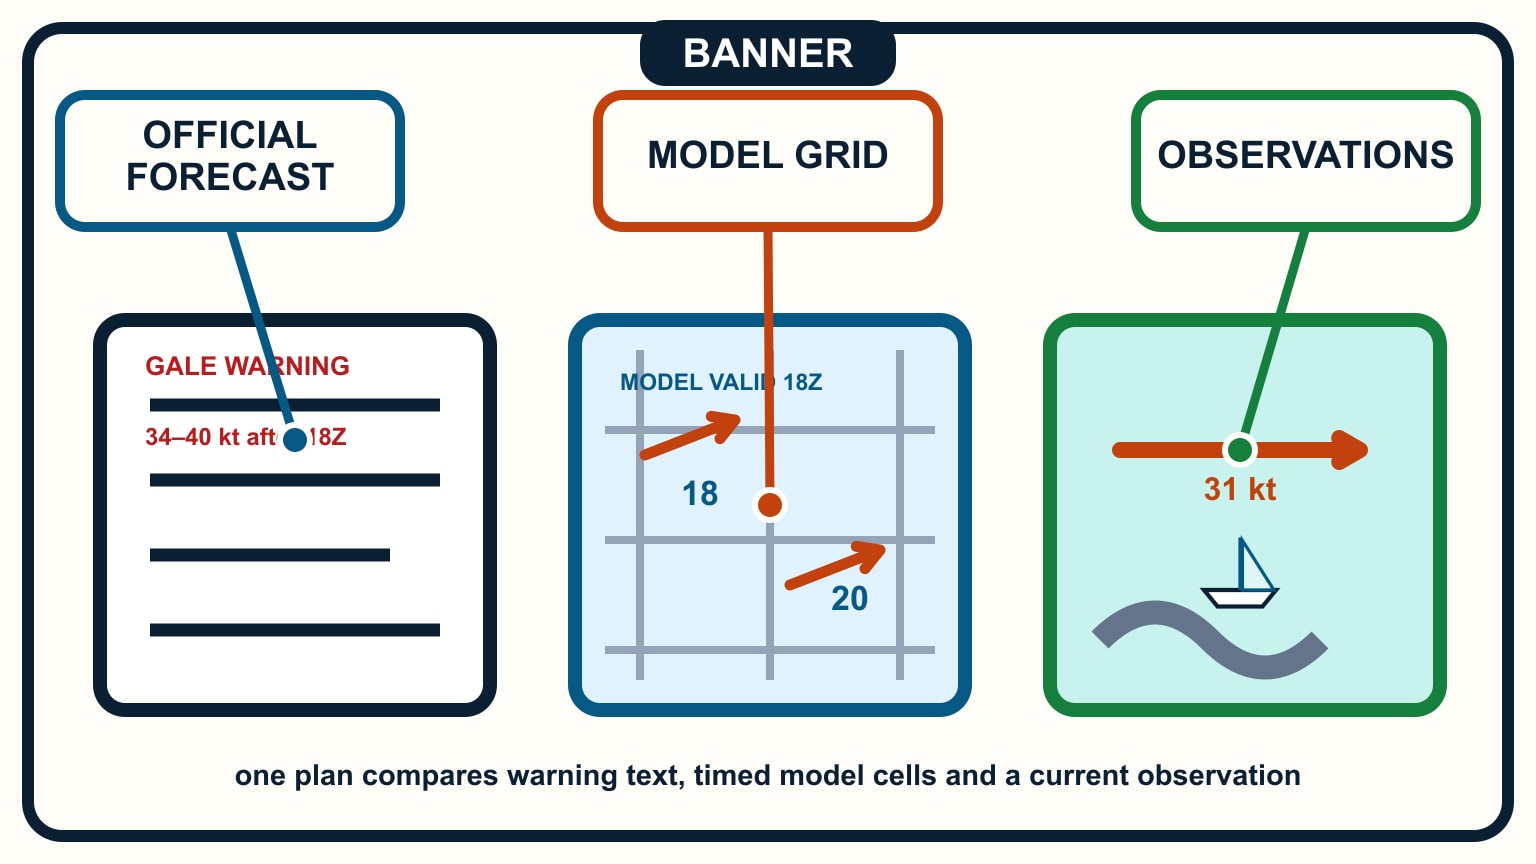
A GRIB display and an official marine forecast are not rival answers to the same question. They are different products. A GRIB viewer plots selected fields from a numerical weather model on a grid. An official forecast is an operational message for a named area, issued by a forecasting service and accompanied by any current warnings. Start with the official forecast and warnings, use GRIB data to explore the pattern, then compare both with what is actually happening around the boat.
That order matters because a clean field of wind arrows can look more certain than it is. It may omit thunderstorms, visibility, sea state, local acceleration, or the forecaster's warning language. Conversely, a regional forecast may not show the hour-by-hour spatial pattern that helps you choose a departure window. The useful question is not “which one is right?” It is “what job can this product safely do?”
This guide assumes you already know how to obtain the current official forecast for your waters. If that process is new, begin with how to read a marine forecast, then add GRIBs as a second layer.
The two products carry different information, so read them in a fixed order rather than picking one.
| Dimension | Official marine forecast | GRIB file |
|---|---|---|
| What it is | An operational message for a named area, issued by a forecasting service | Selected fields from a numerical weather model, plotted on a grid |
| Includes warnings | Yes — active warnings and the forecaster's language | No — a blank layer doesn't mean the hazard is absent |
| Spatial detail | Area/period summary, not an hour-by-hour pattern | Hour-by-hour spatial pattern and timing |
| Local detail near land | Can incorporate local knowledge | Smooths narrow channels, headlands, and islands smaller than the grid |
| Use order | Read first | Read second, to explore the pattern |
Give each weather source one clear job
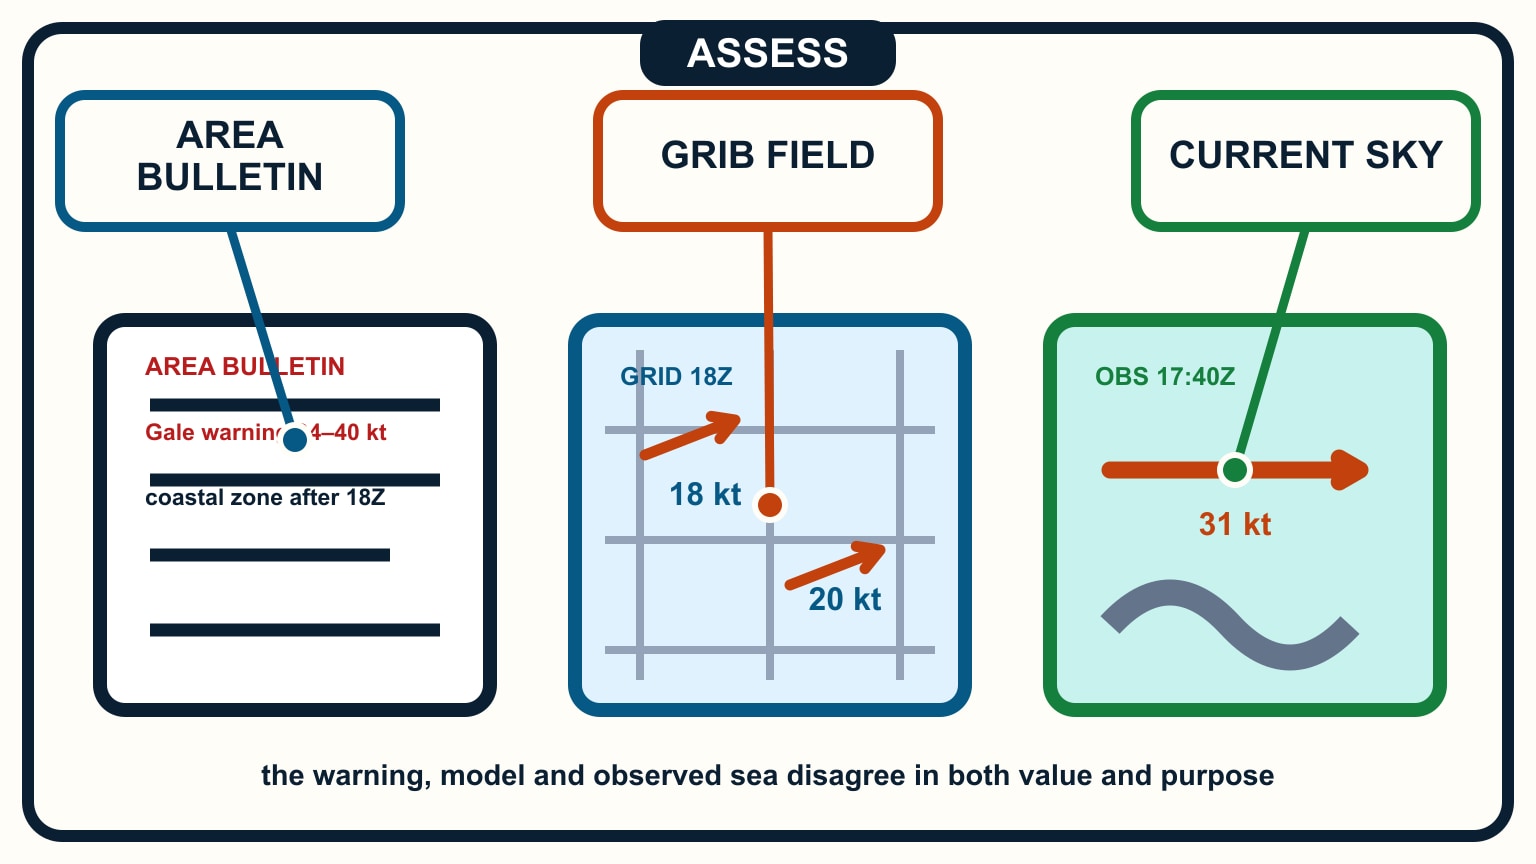
Use the official marine forecast to learn what the responsible service is communicating to mariners: the area and period covered, expected wind and weather, visibility or sea conditions where included, and active warnings. Read the whole product. A warning, synopsis, or timing phrase can change the meaning of a headline wind value.
Use a GRIB view to examine the model's predicted pattern. Depending on the file and viewer, you may be able to step through wind, pressure, precipitation, waves, or other fields. Those layers are only present if they were requested and supplied. A blank layer does not prove that the hazard is absent. It may simply mean that the field is not in the file.
Keep observations in a third column. Record wind direction and strength, pressure trend if available, cloud development, visibility, sea state, and any official buoy or coastal-station reports relevant to the route. The view from one cockpit is local, but it can reveal that conditions are arriving earlier, building faster, or behaving differently from the downloaded guidance.
The three jobs can be written on a passage note:
- official forecast and warnings: operational message for the sea area;
- GRIB: model pattern and possible timing;
- observations: evidence of what is happening now.
Do not let a route line or weather overlay decide whether the crew leaves. The skipper still has to combine the evidence with daylight, shelter, crew condition, the boat's limits, and a usable alternative.
Identify the model run and the time on screen
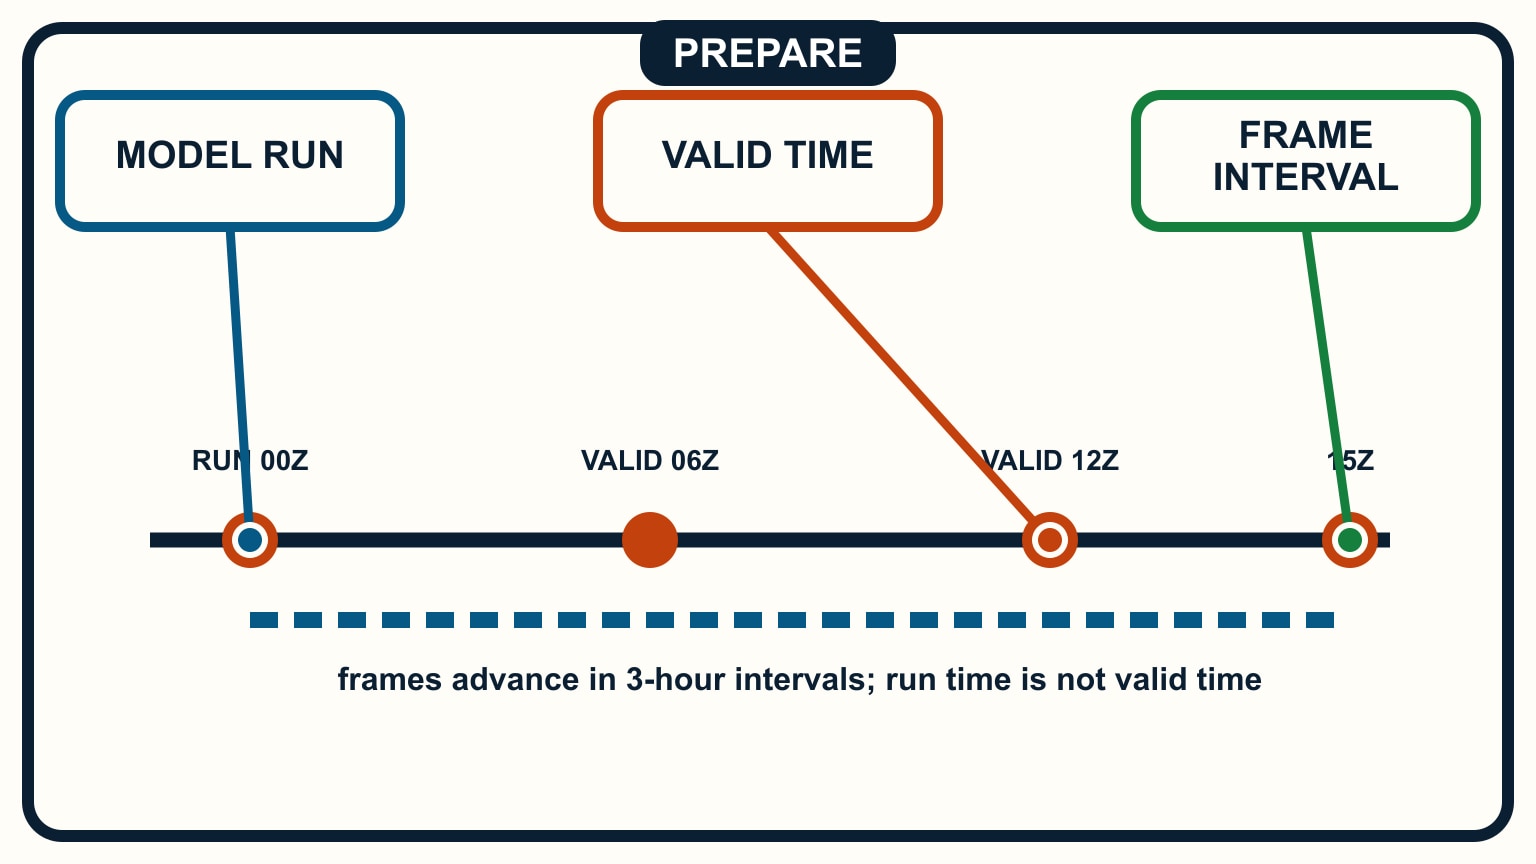
A forecast frame has a valid time: the time the displayed conditions are predicted to occur. The underlying model also has a run or initialization time. Confusing those two can put the crew several hours out of step with a front or wind change.
Before reading the colours or arrows, find four details in the viewer or download description:
- the model or product name;
- the run or issue time, including its time zone;
- the valid time of the frame on screen;
- the forecast interval between frames.
Convert times into one convention for the passage plan. UTC is often the least ambiguous, but local time is workable if every crew member knows what is being used. Beware of an app that displays device time while the source bulletin uses UTC. Write both when briefing a critical change: “front shown near the entrance at 1500 UTC, 1200 local,” for example.
Freshness is more than the age printed beside a download. Confirm the file has finished downloading and that the viewer is not quietly showing yesterday's cached data. Step backward and forward one frame. If nothing changes when a new run is selected, check the timestamp rather than assuming the update succeeded.
A later run is not automatically better for every decision. Compare it with the previous run. A large shift in timing, track, or strength is useful uncertainty information. It argues for more margin and another official update, not for choosing the frame that best suits the preferred itinerary.
Read the grid without inventing local detail
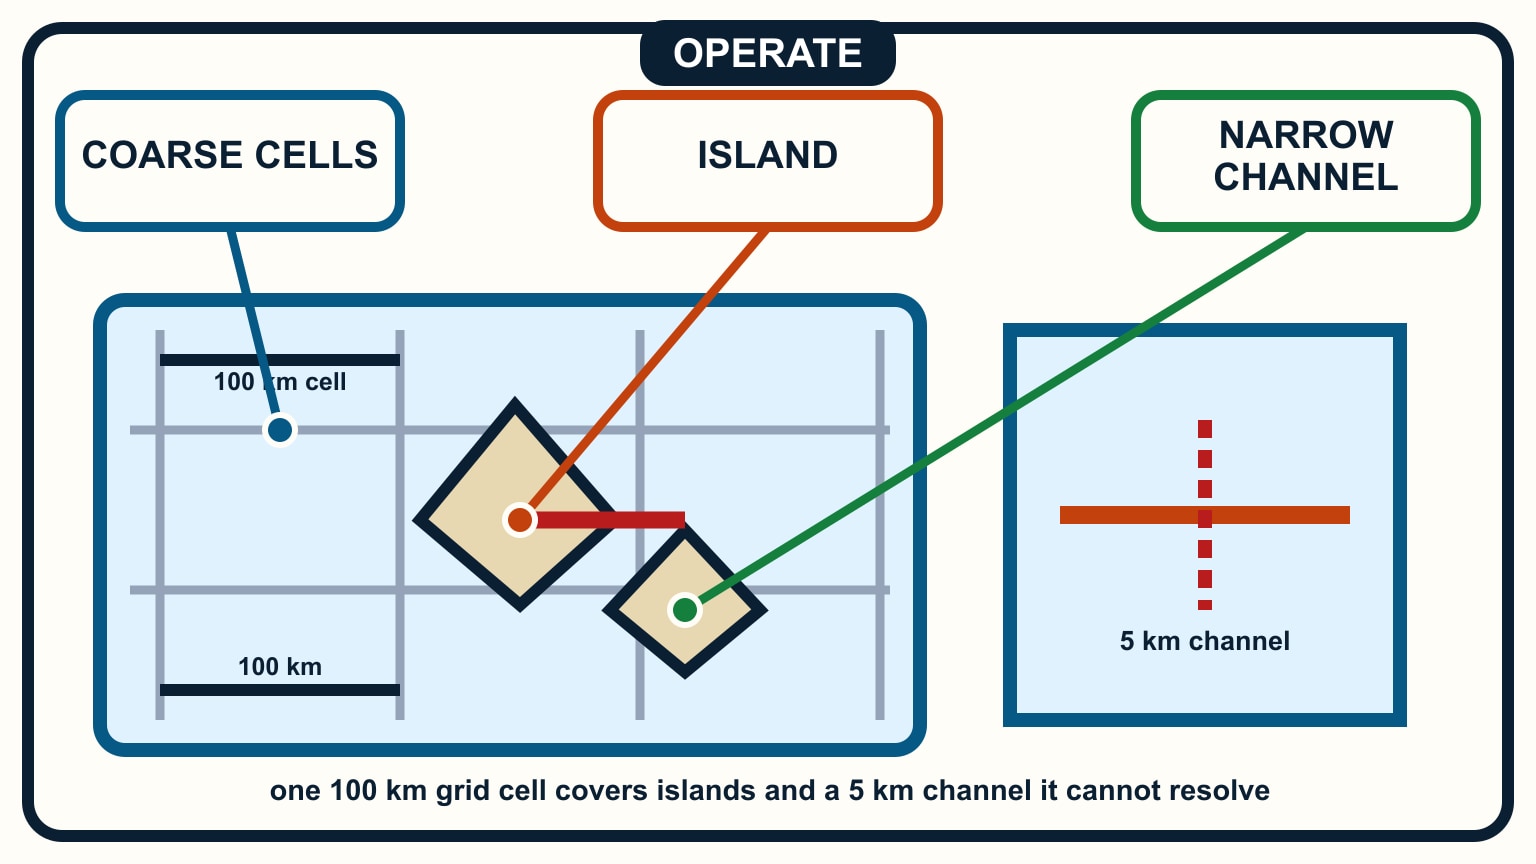
GRIB data is sampled on a grid. The display may draw smooth colours and curved streamlines between grid points, but the polished rendering does not create new observations or terrain detail. A narrow headland, steep island, harbour entrance, or squall may be smaller than the effective model resolution.
Treat a value under the cursor as a model estimate for that grid and time, not a measurement at the masthead. Near land, ask what the grid can actually represent. If several grid cells span an island group, the model may smooth the channels and slopes that shape the wind a crew feels. This is one reason local forecasts, harbour advice, and direct observation remain important.
Check which wind value the file contains. Sustained surface wind, gust, and wind at another level are not interchangeable. If gust data is absent, do not infer that gusts will match the sustained arrows. Likewise, a wind-only file says nothing by itself about visibility, thunderstorms, or wave period. Read a separate wave and swell forecast when sea state affects the route.
Colours also depend on the viewer's scale. The same shade can represent a different range after zooming or changing units. Confirm knots, metres per second, or another unit before briefing the crew. Prefer a numeric check at two or three route points over a general impression from colour.
Finally, look beyond the intended track. The pressure and wind pattern upstream can explain what may arrive next. A single route corridor hides whether the boat sits near a broad stable region or on the edge of a sharp change.
How do you compare guidance with the forecast and the sky?
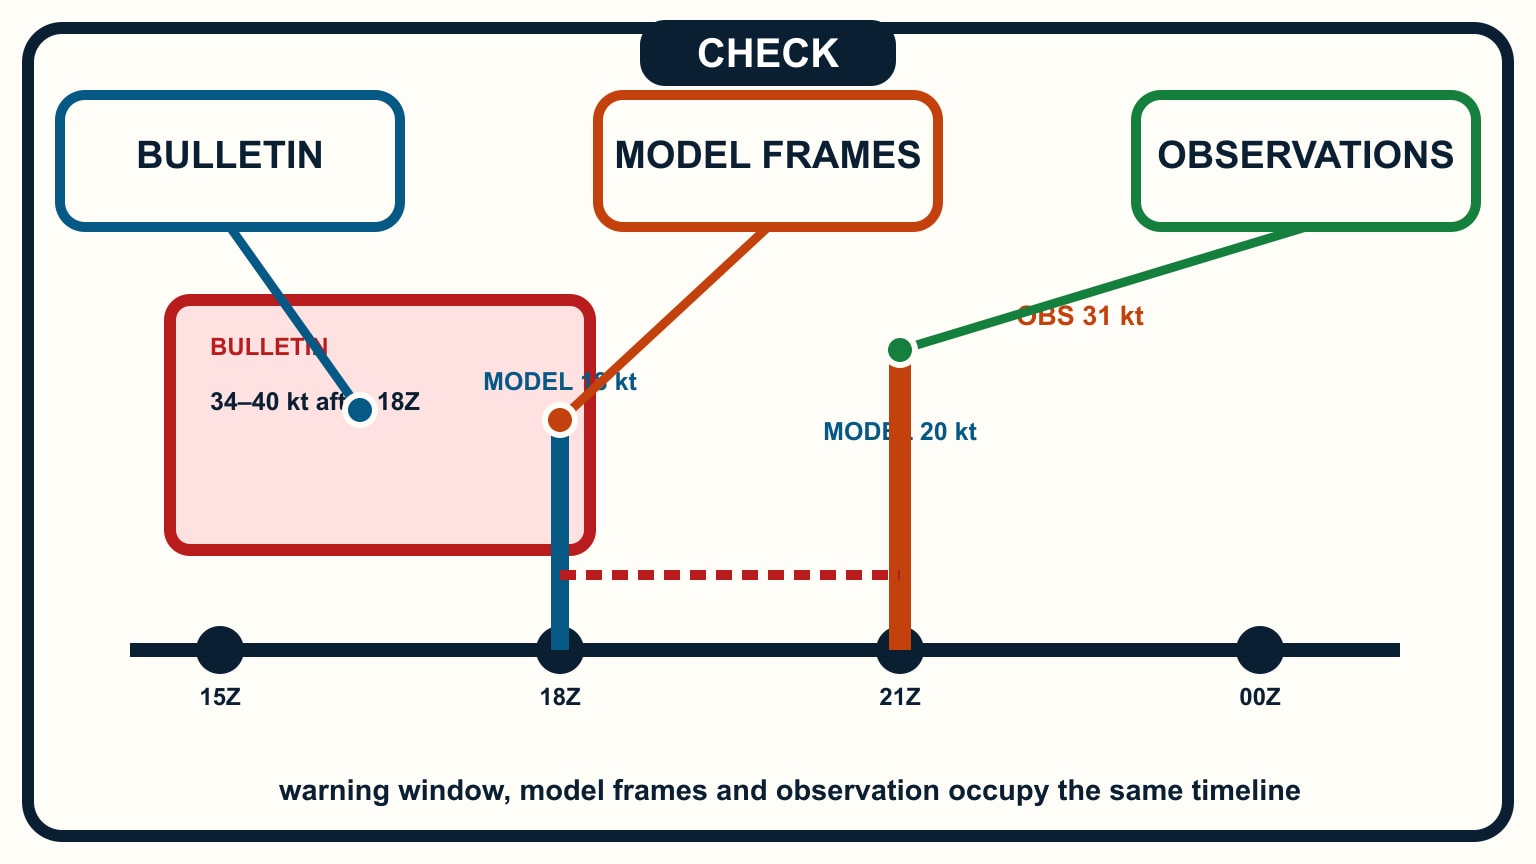
Make the comparison explicit. First read the official bulletin without looking at the GRIB. Mark the forecast wind range, changes, weather, visibility, warnings, and timing words. Then open the model view and ask where it agrees, where it adds detail, and where it conflicts.
Agreement does not remove uncertainty, but it can make the planning story coherent. For example, a written forecast of a later wind increase may align with tightening isobars and rising arrows across successive frames. Disagreement is more valuable than it first appears. If the bulletin warns of stronger conditions than the GRIB shows, plan for the warning. A human forecaster may be accounting for observations or hazards that are not represented in that file.
Now compare both with current reports and the view outside. Is the pressure trend consistent? Are clouds developing on the expected side? Has visibility fallen? Is the wind already above the early-frame prediction? One mismatch may have an innocent explanation, including a very local effect. Several mismatches mean the planning model is losing support.
Do this check at defined moments rather than continuously chasing the screen: before departure, before the last easy shelter, and before a constrained entrance are sensible examples. Download updates while connectivity is reliable. A passage plan should still work if the weather app stops loading offshore.
Brief the uncertainty as plainly as the forecast. “The official forecast and model agree on the direction, but the model brings the increase two hours earlier” gives the crew something actionable. “The app says it is fine” does not.
When should you replan?
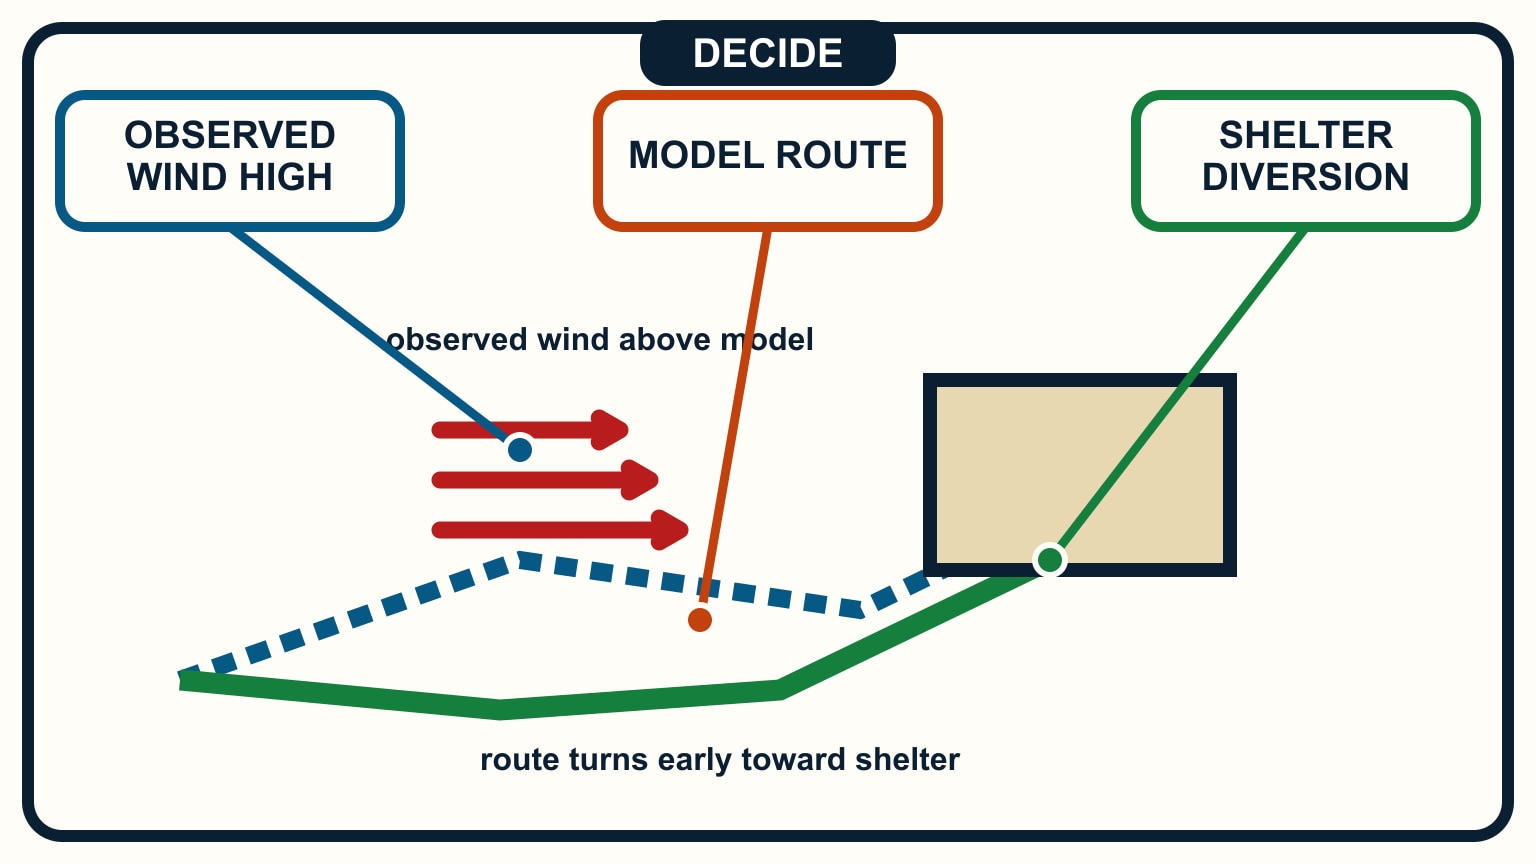
Set limits while the choice is easy. They may relate to an official warning, an observed wind or sea-state threshold, visibility, a pressure change, crew fatigue, daylight, or the time needed to reach shelter. The exact limits belong to the boat, crew, route, and local authority guidance. Put them in the passage plan rather than inventing them after conditions deteriorate.
If new observations fall outside the shared story, shorten the next decision interval. Seek the latest official forecast and warning, compare a fresh model run if available, and choose the least committed safe option. That can mean waiting, returning, entering the nearer shelter, or abandoning the day's destination.
Never average a warning and a favourable model into a comfortable middle answer. Never use one attractive run to cancel several less favourable signals. Model spread, run-to-run movement, and conflict with observations are reasons to add room.
After the passage, keep a small record of forecast, GRIB frame, and observed conditions. It will teach you how the products behave in your sailing area without pretending that yesterday's relationship is a permanent rule.
The practical habit is simple: bulletin first, grid second, observations throughout, and a decision that can still change. Build that sequence into your float plan weather check, then practise it on a short day sail before relying on it for a longer route.
Try it from the lesson
Can you spot the next move?
Your weather app, opened this morning, shows calm conditions. It's now mid-afternoon and you're about to leave. What should you check first?
Why you can trust this guide
. We build each guide from public seamanship and safety sources, then teach the universal principle before any local difference.