Chart your course
How to Read Wave and Swell Forecasts
Quick answer
The short version
Read a wave forecast as a set of connected values, not as one height. Separate locally generated wind waves from swell that has travelled away from its source. Then check significant wave height, period, direction, and the time each component changes. Compare those values with your route, current, depth, headlands, and harbour entrance. The same forecast height can describe a manageable long swell or a much steeper, less comfortable sea. Finish by reading the marine warning and forecast discussion, then compare the model with current buoy and shoreline observations before deciding.
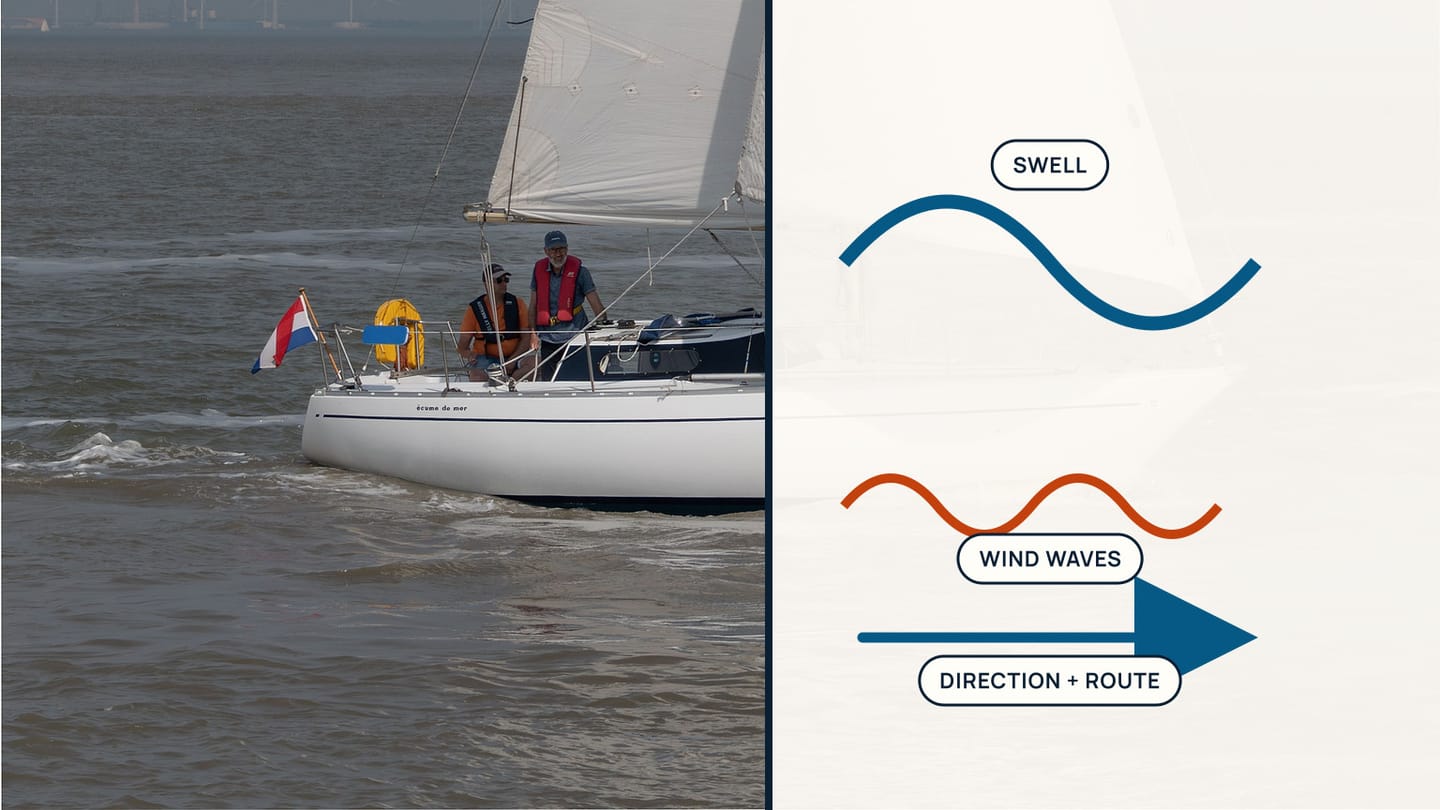
Wave pages often present a clean number beside a tidy icon. Real seas contain several wave systems at once. NOAA describes significant wave height as the average height of the highest third, so it is not a ceiling on individual waves. NOAA also reports wind-wave and swell components separately at many stations. The useful question is therefore not “How high are the waves?” but “What wave systems will meet my boat, where, and when?”
Use this guide with how to read a marine forecast, the local-wind patterns in land breeze vs sea breeze, and the route choices in how to plan a sailing trip. Forecast products and warning names differ by country. Use the official service for your location and verify current local guidance.
Separate wind waves from swell
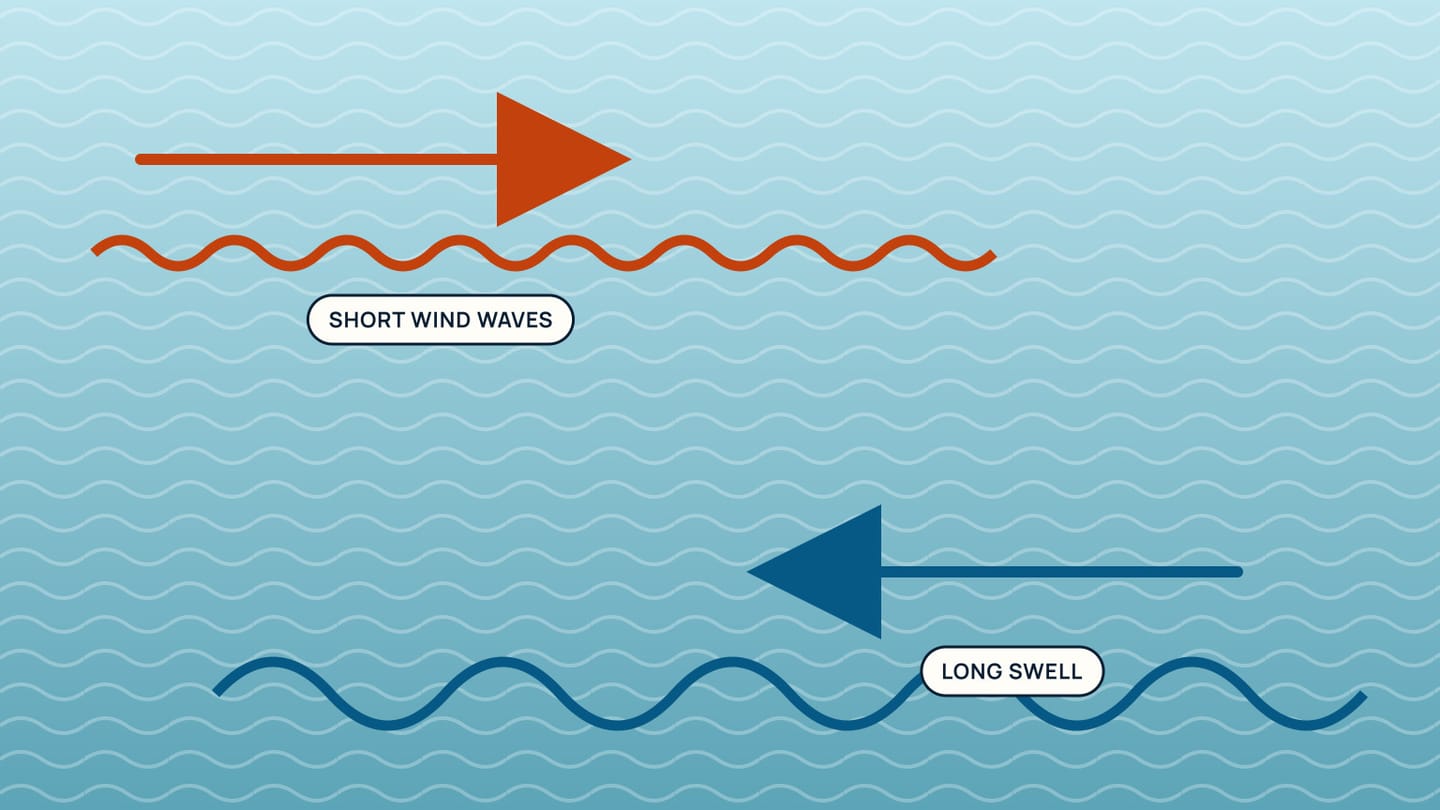
Wind waves grow under the local wind. Swell has travelled out of the area where it formed. A forecast can contain both, moving from different directions and with different periods. NOAA notes that swells tend to have longer periods and wavelengths than locally generated wind waves. Treating the two as one number hides the shape of the sea your boat will meet.
Start by locating the component list. It may show total or significant wave height, wind-wave height, and one or more swell trains. Record the direction and period beside each component. A modest local chop crossing an older swell can produce an irregular motion even when neither listed height looks large. A single dominant swell may feel more regular offshore yet change sharply near shoals or harbour structures.
Direction is usually the direction waves come from, but confirm the convention used by the product. Put each arrow on your route. Waves from ahead affect pitching and speed differently from waves on the beam or quarter. Then add the wind arrow. When local wind and swell come from different directions, expect two visible patterns rather than forcing every crest into one explanation.
At the water, test the forecast. Look for a longer, more regular crest pattern beneath shorter local ripples. Check an official buoy report where available. If observation and forecast disagree, do not average them into reassurance. Find the newest forecast run, read the discussion, and make the plan from the more conservative credible picture.
Read height and period together
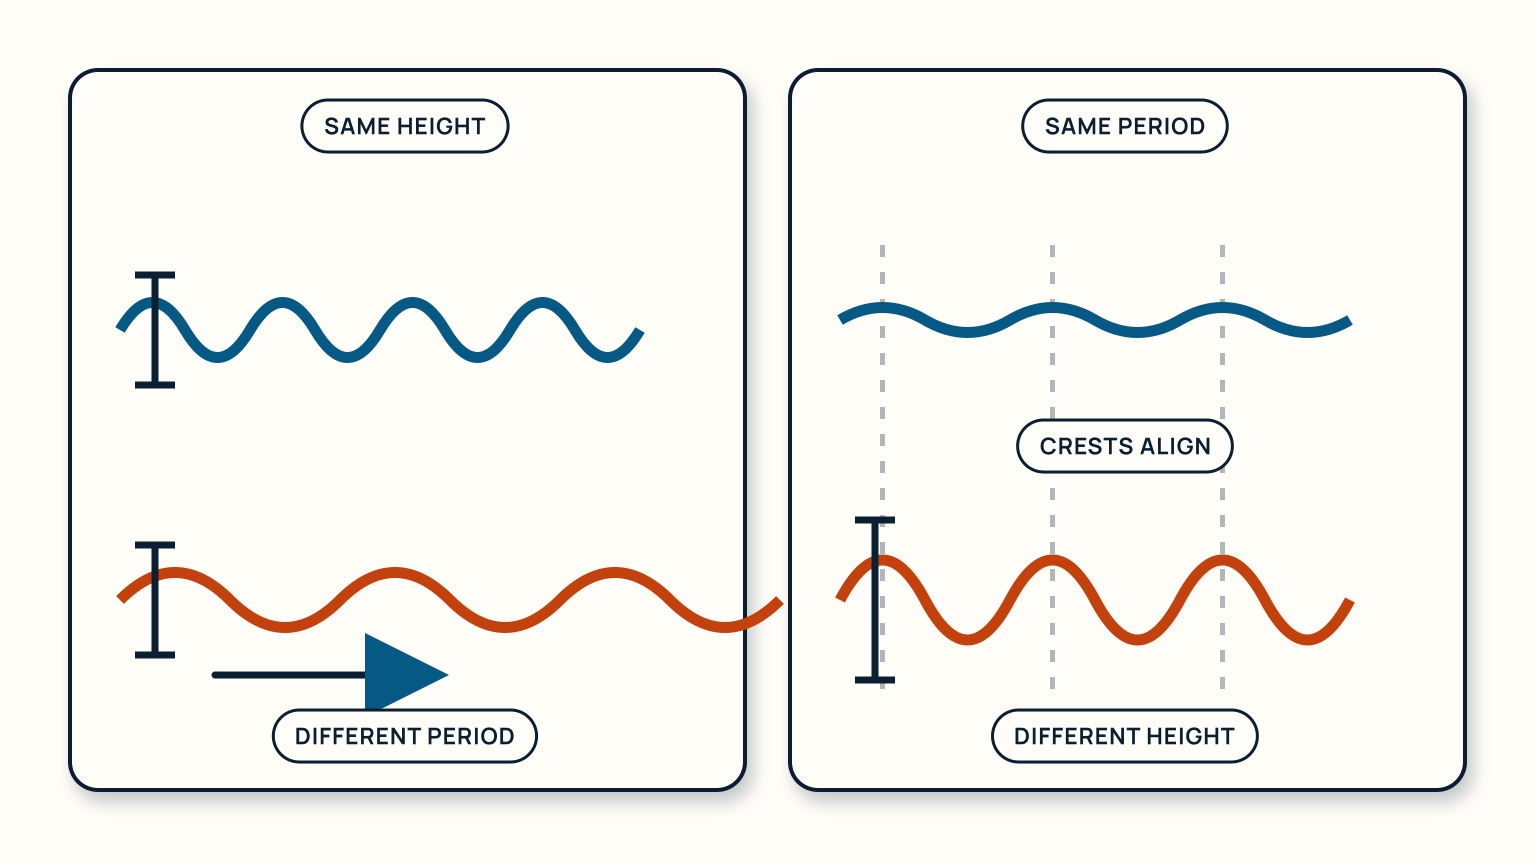
Height describes vertical size. Period is the time between successive crests at a fixed point. Together they help describe steepness. NOAA's buoy guidance explains that, for a given height, steeper waves are a greater threat to vessels than broad swell. That is why a height without a period cannot finish the assessment.
Significant wave height needs careful language. It represents the average of the highest one-third of waves in the observed or forecast sea. Individual waves vary around it, and NOAA warns that some can be much higher. Do not read a forecast of two metres as a promise that no crest will exceed two metres. Read it as a statistical description of an uneven field.
Compare two hypothetical forecasts. Both show the same significant height. One pairs it with a short period and local onshore wind; the other shows a longer-period swell with light wind. The first describes crests packed more closely together. The second describes a broader pattern. That distinction affects motion, deck work, and how much time the boat has between crests, even before local depth changes either system.
Avoid turning period into a universal go/no-go threshold. Boat length, hull form, experience, route orientation, breaking conditions, and crew tolerance all matter. Use height and period to identify the character of the sea, then make a boat-specific choice with the skipper. If you do not understand how your vessel behaves in that combination, choose sheltered water or wait for supervised experience.
Compare direction with the route
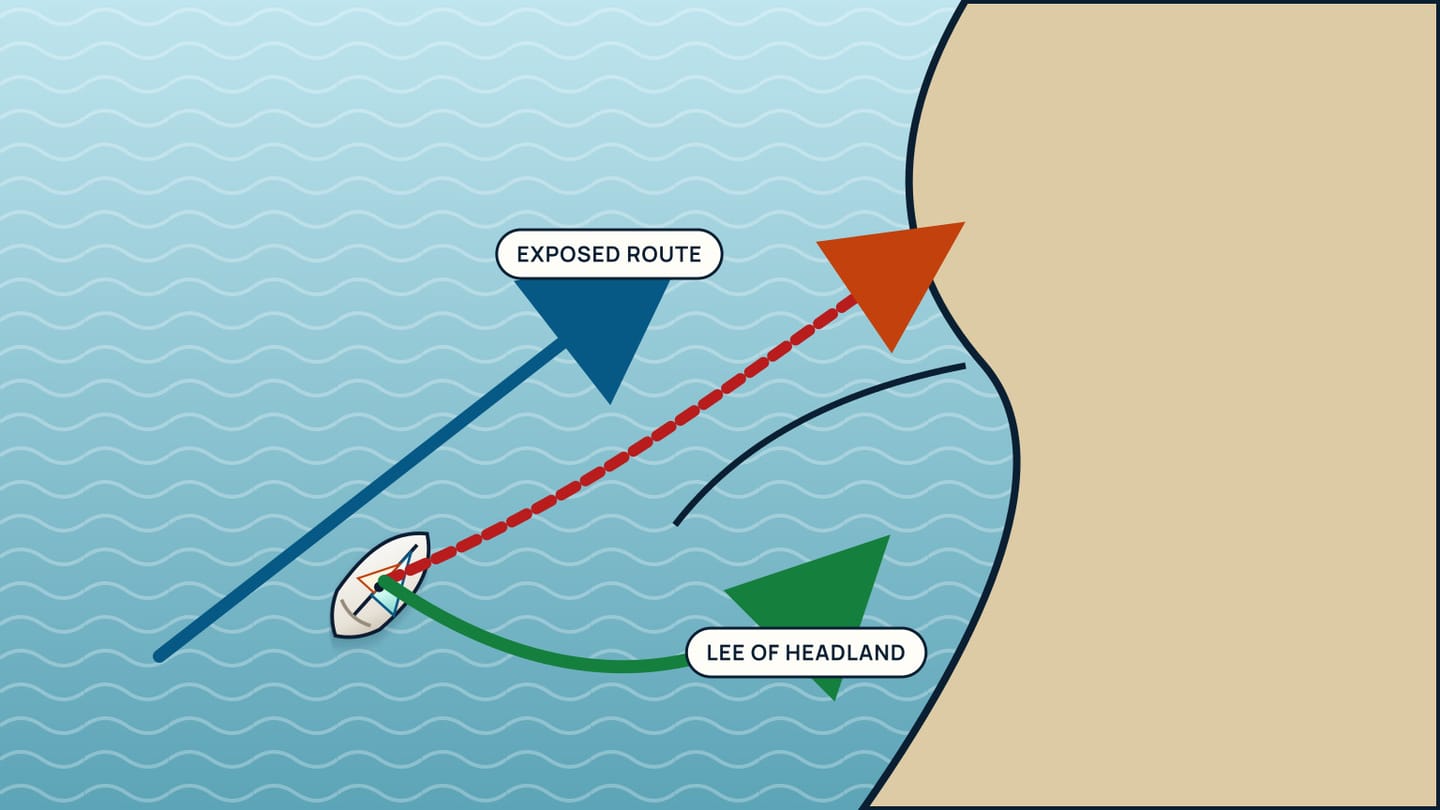
A wave forecast becomes practical when you rotate it onto the chart. Mark the direction each component travels from, then trace the course for every exposed leg. A route parallel to the coast may begin with swell on the bow, round a headland with it on the beam, and finish with it astern. One forecast point can therefore produce several different experiences.
Look for places where geometry concentrates the problem. Headlands expose a boat to wave systems that were hidden in a bay. Shallow banks can change wave height and steepness. Harbour entrances reflect, refract, or confine wave energy, and opposing current can shorten the apparent spacing. The exact effects require local knowledge, so use sailing directions, official harbour information, and recent observations rather than inventing a rule from the regional forecast.
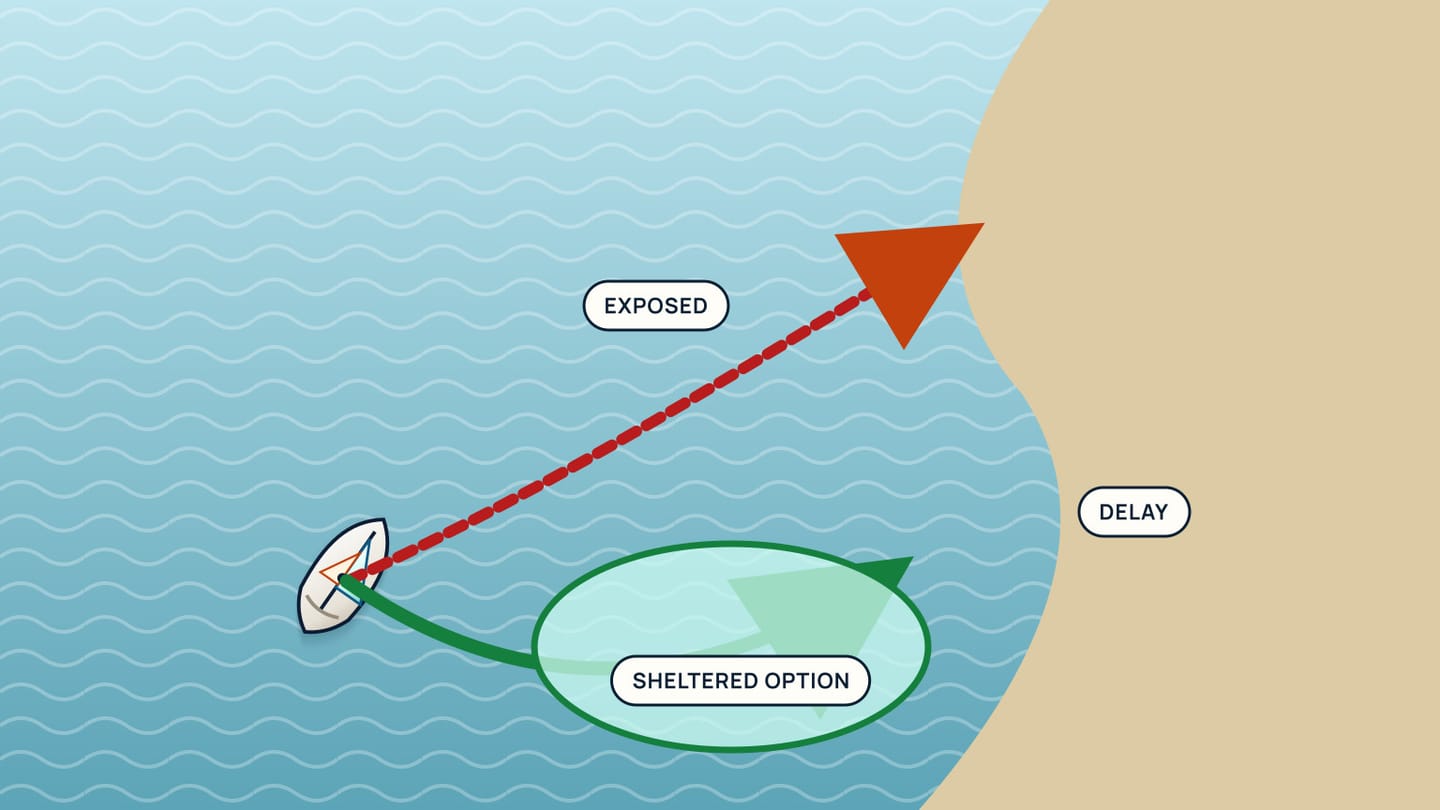
Work a route from the difficult point backward. Suppose an offshore swell is acceptable along the open leg but arrives across a narrow entrance. The key time is your arrival at that entrance, not your departure from home. Check the forecast component at arrival, the tide or current window, daylight, and an alternate harbour. If the margin depends on every estimate being perfect, the plan is already too tight.
Do not let a route planner's coloured overlay replace the source forecast. Colours often compress several categories, and arrows can be sampled from a broad grid cell. Read the underlying values and issue time. A course line drawn between two points cannot see breaking waves on a bar or a local wind shadow unless the product explicitly models them.
Follow timing, updates, and uncertainty
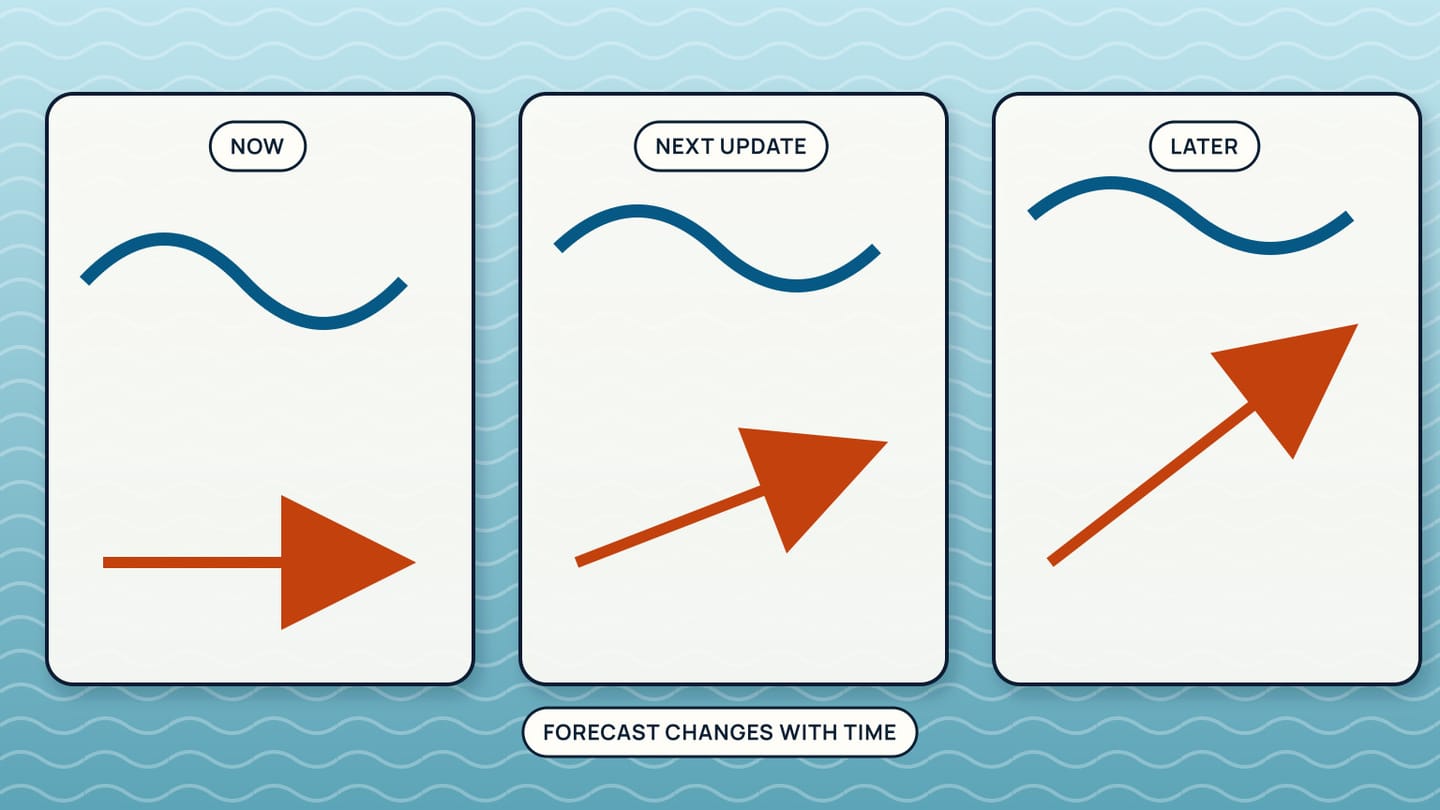
Forecasts are valid for particular times. Scroll through the whole trip rather than reading only the departure frame. Note when wind waves build, when a new swell arrives, and whether the components rise or fall together. A calm morning icon does not protect an afternoon return leg.
Check the issue time and model cycle. A forecast viewed twice is not necessarily the same forecast; newer observations may have changed it. Compare consecutive official updates to see whether the difficult conditions arrive earlier, later, stronger, or weaker. A stable trend improves understanding, while a moving arrival time tells you the boundary remains uncertain.
Use observations as a live checkpoint. Official buoys can report significant height, dominant period, wind, and sometimes component directions. Shore cameras and visible breakers can show local conditions, but perspective can make height hard to judge. Combine them with the official product instead of selecting the observation that best supports the outing.
Build decision times into the plan. Recheck before leaving the dock, before entering the exposed leg, and before passing the last easy refuge. State what change cancels the next leg. That condition might be a warning, a component arriving early, or observations failing to match the forecast. It should be something the crew can identify before the boat reaches the difficult water.
Turn the forecast into a conservative call
Bring the pieces into one spoken summary: “local waves from this direction, swell from that direction, this period, building or easing at this time.” Then add the route: which leg is exposed, which location changes the wave shape, and where you can stop. If you cannot explain the picture plainly, return to the official product before asking the crew to rely on it.
Match the plan to the least experienced person aboard. A forecast can be within a boat's technical ability and still be a poor first experience for someone who cannot move safely or rest in that motion. The decision includes the crew, not only the hull.
Keep an alternate that remains usable if the timing is wrong. A shorter sheltered route, later departure, different entrance, or day ashore preserves the purpose of the trip without demanding that the forecast behave exactly. This is not excessive caution. It is how a probabilistic product becomes a practical plan.
After sailing, compare the forecast with what you saw. Record which component dominated, where waves steepened, and whether the timing held. Do not revise the meaning of the forecast from one outing. Use the notes to improve how you interpret that waterway and your boat while continuing to rely on current official information.
SailStarter's weather lessons help you connect forecast terms with visible evidence on the water. Use them before a forecast briefing with an experienced skipper, then make the final decision from current official products, local guidance, and the actual crew and boat.
Try it from the lesson
Can you spot the next move?
A short ribbon on a supporting wire of the mast streams out sideways. What is it showing?
Why you can trust this guide
. We build each guide from public seamanship and safety sources, then teach the universal principle before any local difference.