Chart your course
How Deep Will It Really Be? Reading a Tide Table
Quick answer
The short version
A tide table doesn't hand you today's depth directly: it gives the predicted height of the tide, above a fixed low-water reference called chart datum, for a specific time and place. You work out the real number yourself: actual depth = charted depth (the number printed on the chart) plus height of tide (the number you read from the table). Charted depth alone sits close to the least water you'd ever find there, because charts are drawn against that low reference on purpose. Look up the tide height for the time you'll be there, add it to the charted depth, then subtract your own draft. What's left is your clearance, with a safety margin built in before you commit to a shallow bar, an anchorage, or a tight berth.
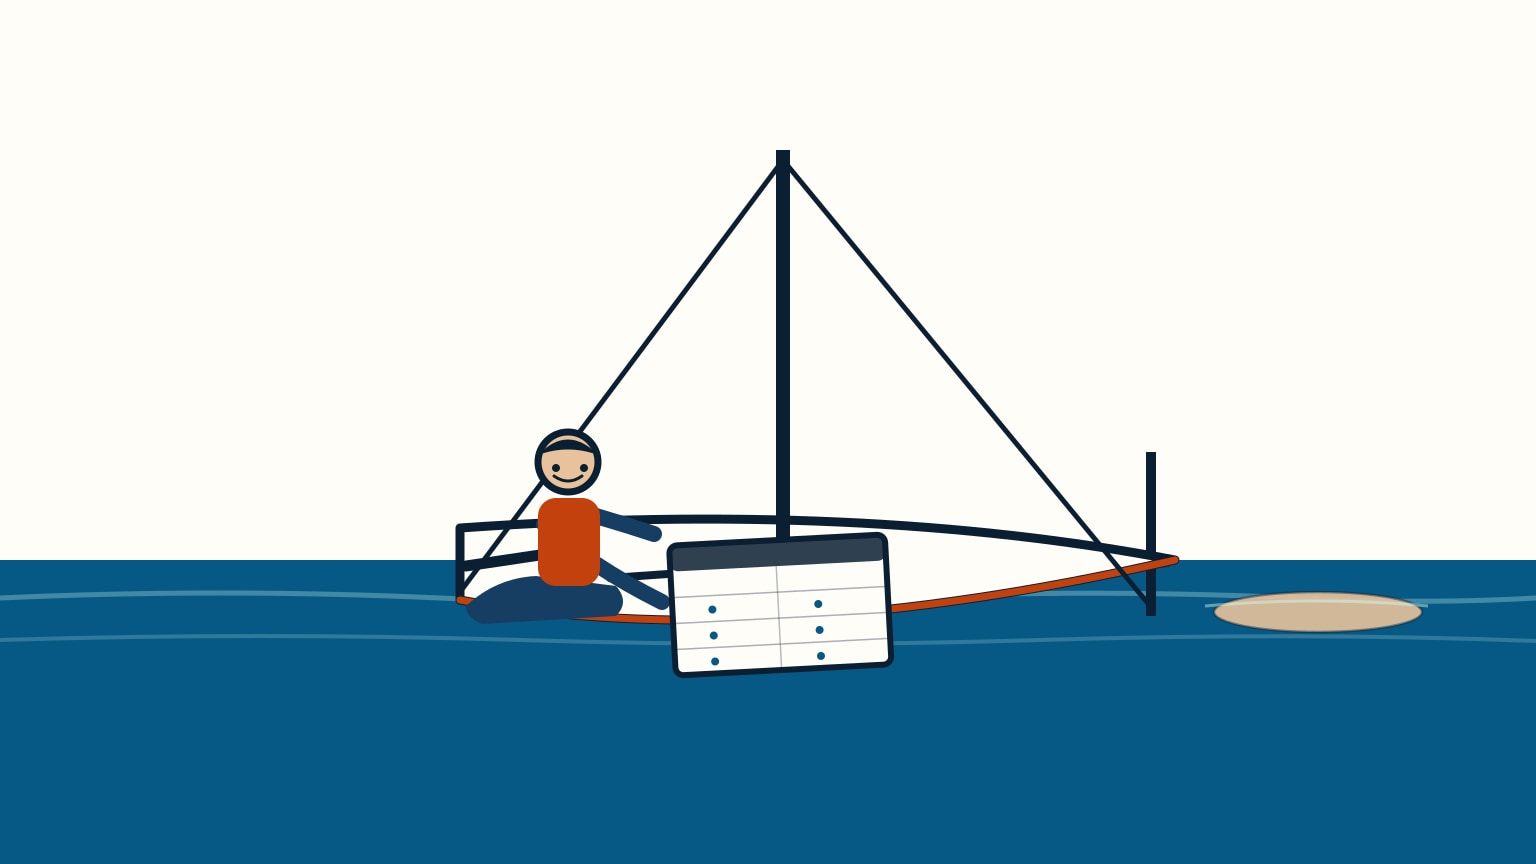
Picture a chart reading 2.0 metres over a shoal you need to cross, next to a boat that draws 1.8 metres. That looks alarmingly thin, until you remember a chart isn't telling you today's depth. It's telling you close to the shallowest depth you'll ever find there, because charted depth is measured against a deliberately low reference. What you actually get today depends on the tide, and that's exactly what a tide table gives you: predicted times and heights of high and low water, worked out well ahead of time from the pull of the sun and moon on the sea. Read one correctly and that unsettling charted number turns into today's real one. It also tells you when a drying patch will be covered and warns you when the plan needs more margin than the bare arithmetic suggests.
What a Tide Table Actually Gives You
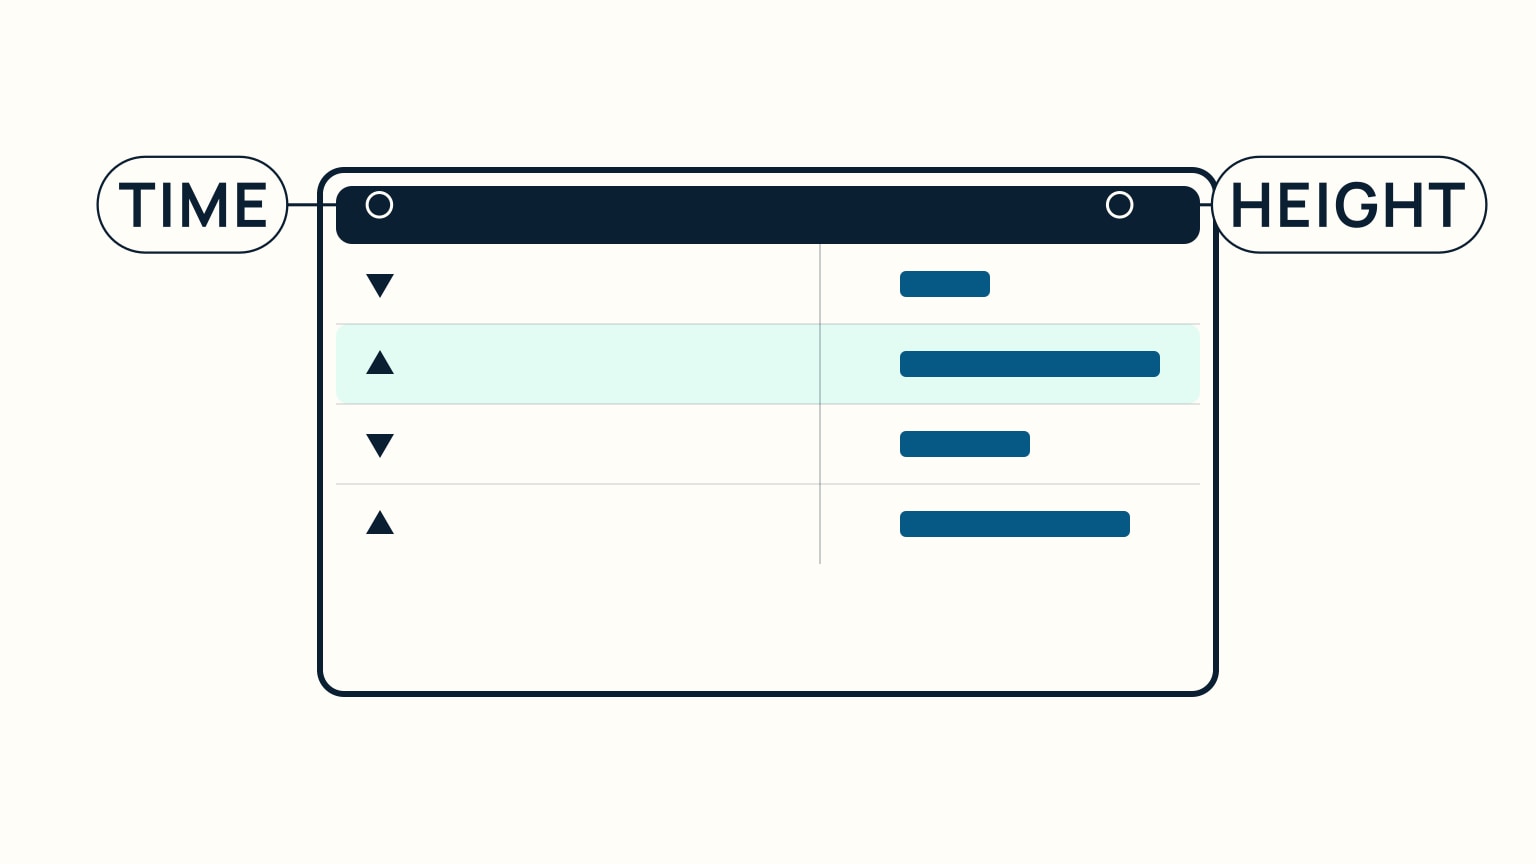
At its simplest, a tide table lists the predicted time and height of every high water and low water at a place, usually one row per event, for every day of the year. A larger port with its own long history of observations: a reference or standard port: gets direct predictions. A smaller port nearby often doesn't get its own line at all: instead, the table gives corrections, a time offset and a height adjustment, to apply to the nearest reference port's numbers.
Between a high and a low, the water doesn't move at a steady rate. It rises and falls fastest around mid-tide and almost stalls for a short stretch right at the very top and bottom, a pause with its own name: the stand of the tide. None of this is a live reading; it's a prediction, calculated in advance from the regular pull of the sun and moon. That's exactly why the rest of this article matters: turning a predicted height into today's real depth takes one more step.
Charted Depth Plus Tide Height Equals Actual Depth
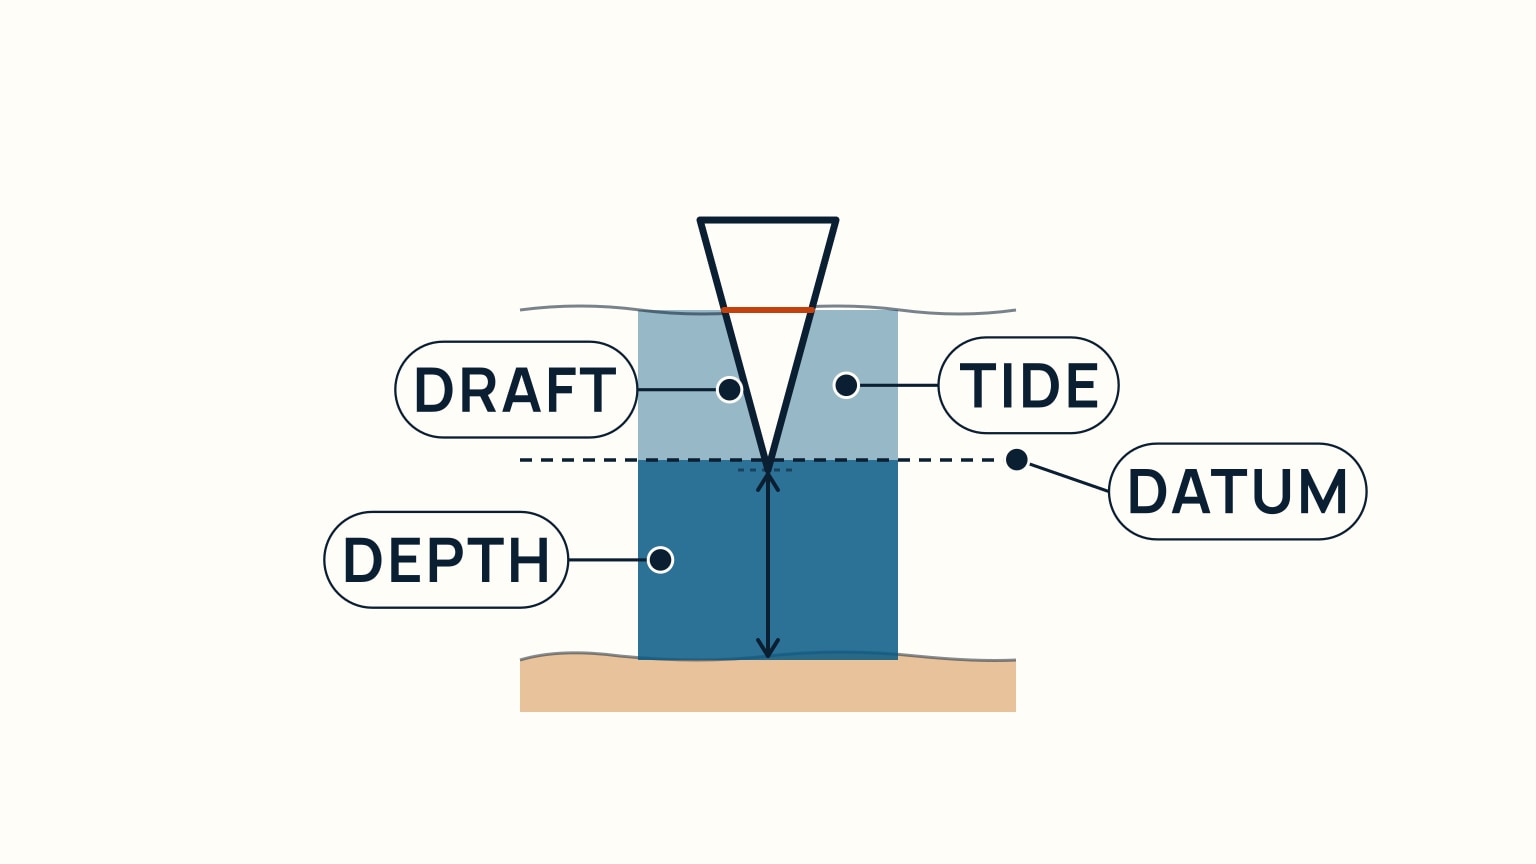
Every number printed on a chart, including the one over your shoal, is measured from chart datum, a fixed low-water reference the chart itself states along with its other basics. Charted depth on its own is close to the least water that spot will ever show; add today's tide on top of it and you get today's real depth: actual depth = charted depth + height of tide.
Say a chart shows a charted depth of 2.0 m over a shoal, and your table gives a height of tide of 1.5 m for the time you'll cross (an illustrative pair of numbers, not a rule to memorise). Add them: about 3.5 m of water. Subtract your boat's draft, say 1.6 m, and you're left with roughly 1.9 m of clearance under the keel. Run that same arithmetic before every shallow crossing, and the charted number stops being the scary one.
Drying Heights: The Underlined Numbers
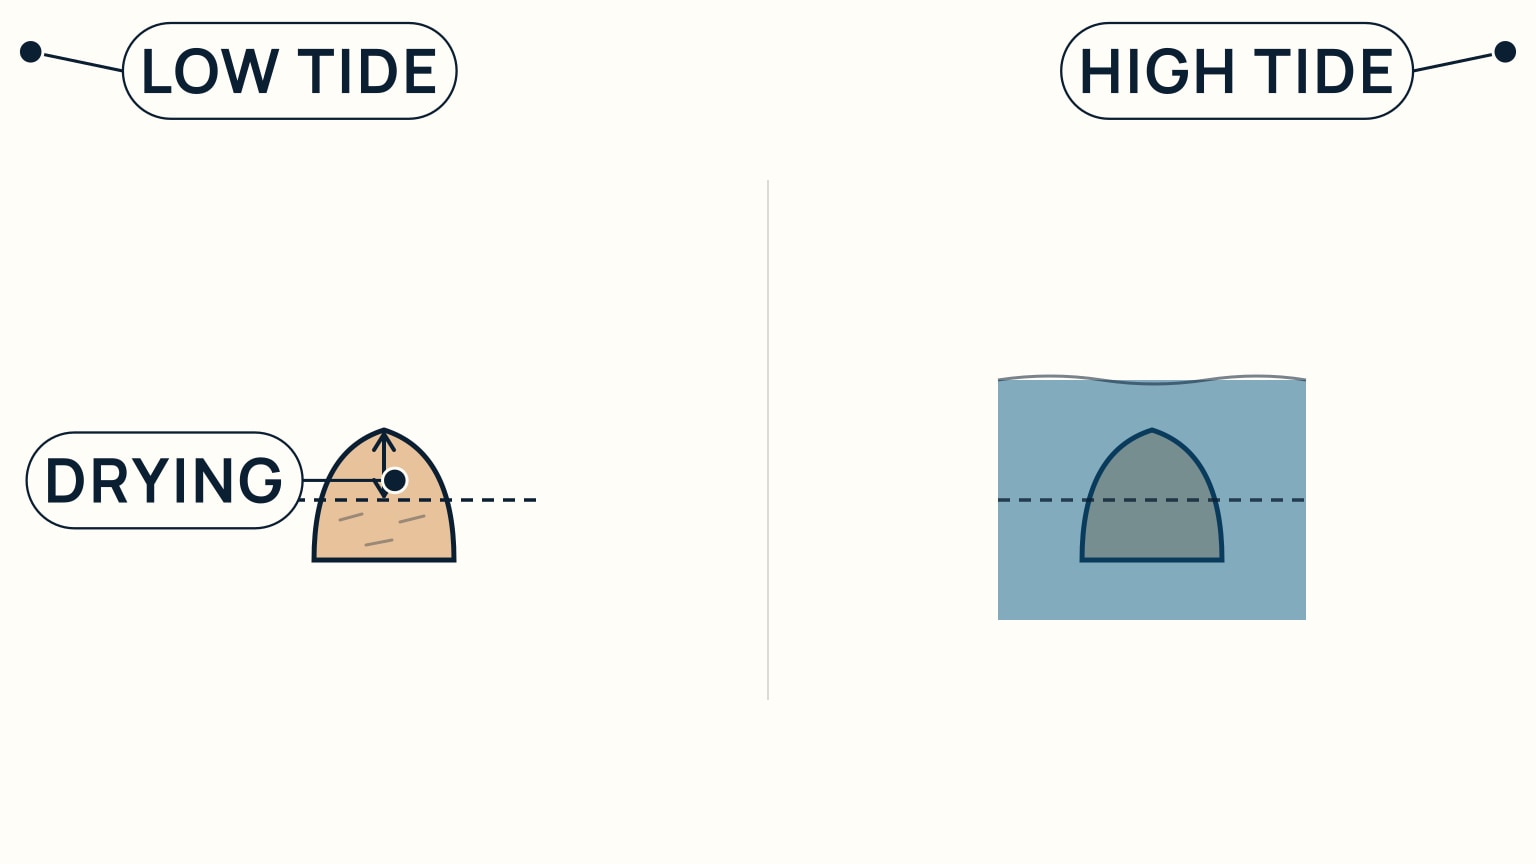
Some patches of seabed come out of the water entirely at low tide, and a chart marks those with a drying height instead of an ordinary sounding: an underlined figure, giving how high that patch sits above chart datum. An underlined "04," for instance, means 0.4 m of mud or sand poking up above datum, dry until the tide covers it.
The arithmetic flips slightly for a drying patch: depth of water over it = height of tide − drying height. While that's negative, the patch is still dry; once the rising tide's height passes the drying figure, water starts covering it, and the result becomes your actual depth there. Reading an underlined number as dry ground rather than a shallow spot is the one habit that keeps a drying height from being mistaken for an ordinary shoal.
Habits That Keep the Numbers Honest
Write the complete depth calculation
Start with charted depth at the position and note its datum and units. Find predicted tide height for the correct standard or secondary port, date, time zone, and reference. Apply the tide height with the correct sign. Then subtract the boat's current draft and the safety margin chosen for waves, uncertainty, squat, heel, and bottom type.
Keep each line visible. A calculator result without its inputs is hard to check. If the chart and tide source use different datums, do not combine them until you have authoritative conversion guidance. The draft and under-keel-clearance guide works through the full margin.
Estimate between high and low water carefully
A tide table gives predicted times and heights at listed high and low waters. Water level between them changes continuously and not always at a simple constant rate. Use the interpolation method supplied by the authoritative tide source for the area. Do not apply a remembered rule from another tide regime without checking that it fits.
Secondary-port corrections may alter both time and height. Apply them in the order and units stated by the source. Confirm whether daylight-saving or local time has already been included. One unnoticed hour can move the plan into a very different part of the curve.
Compare prediction with reality
Wind, atmospheric pressure, river flow, waves, and local effects can move observed water above or below prediction. Check official observations and warnings where available. At the boat, compare sounder readings with expected depth after confirming its offset.
Set a latest safe time and a minimum observed depth before entering a shallow route. Turn back if the water does not match the plan while there is still room. A predicted height is an input, not a guarantee.
Record source, edition, port, date, time zone, corrections, calculation, and observed result. The next passage then has a checked example rather than an unexplained number in the log.
For a drying berth or route, calculate both the time water becomes deep enough and the time it becomes too shallow on the return. Include the height of any drying feature above chart datum. Keep the boat's draft and chosen clearance separate so you can change one without rebuilding the whole calculation.
If the plan depends on a narrow tidal window, prepare an alternate berth or route. Engine delay, weather, traffic, or a slower passage can consume the margin. State the departure cutoff before leaving, then follow it.
A few habits protect the arithmetic itself. First, check the table's stated time zone or time basis before you read a single time off it. That basis doesn't shift itself for daylight saving time, so where DST applies, you add the hour by hand. Second, know roughly where you sit in the lunar month: spring tides, near new and full moon, give the biggest range between high and low water; neap tides, near the moon's quarters, give the smallest.
Last, remember what a tide table actually is: a prediction calculated well in advance from the pull of the sun and moon. It is not a live reading of what is happening outside. Wind and air pressure can push the real water level away from the predicted one. That's exactly why the arithmetic gets a safety margin, rather than an exact answer alone, before you commit to a shallow bar, an anchorage, or a tight berth.
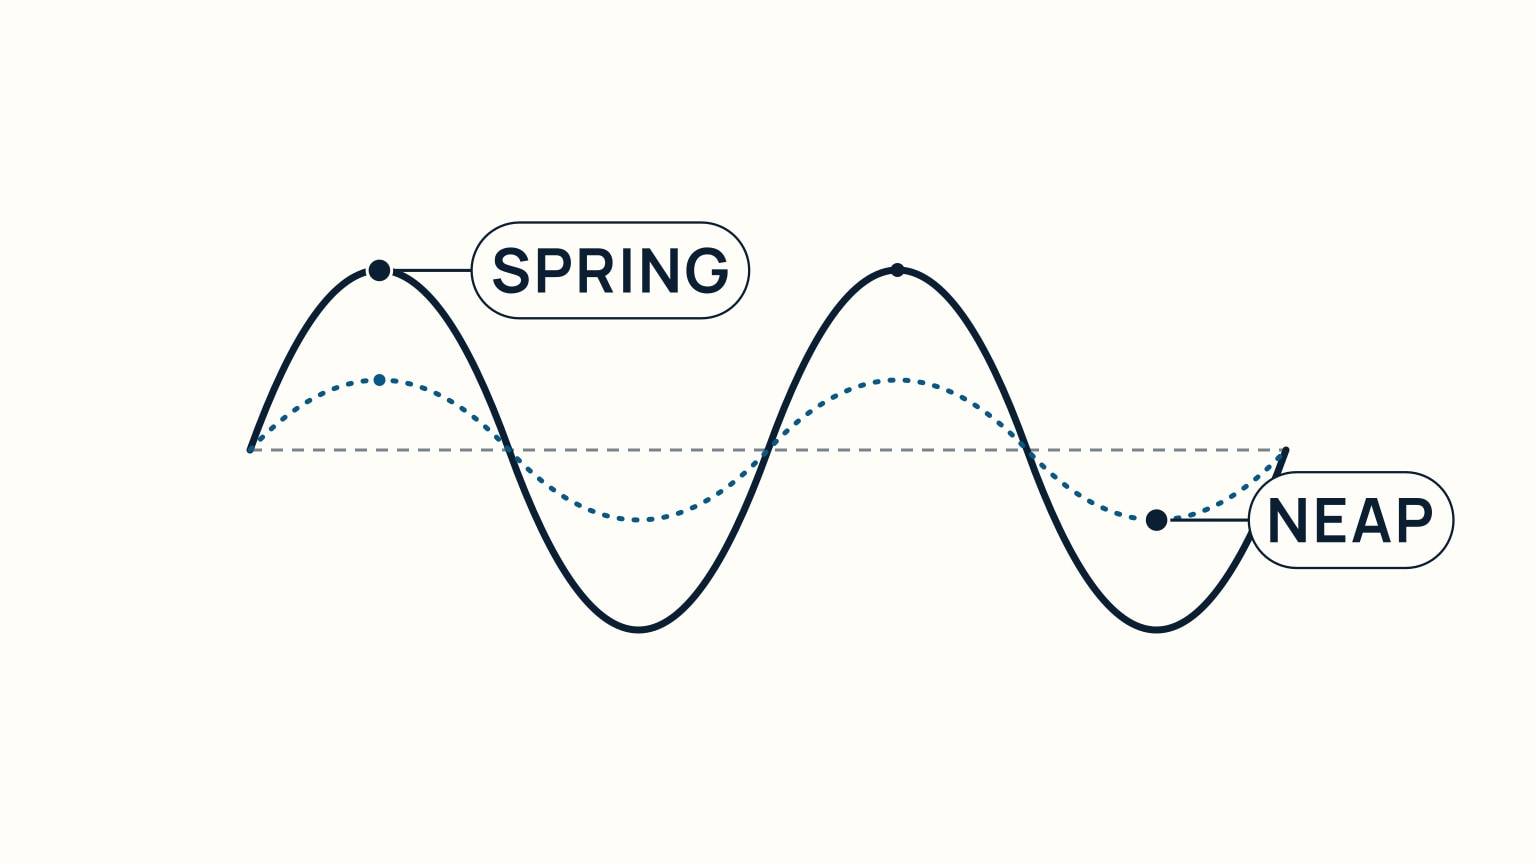
None of this needs to be memorised in one sitting. It's the same habit every time: read the table's stated time basis, find the height of tide for the moment that matters, add it to the charted depth, and subtract your own draft before you trust the answer. Do that with a drying height in the mix, or a spring tide's wider range, and the same arithmetic still holds.
SailStarter's lessons work through exactly this, tide table and chart side by side, until turning a charted number into today's real depth stops feeling like guesswork. If you've ever eyed a shallow-looking number on a chart and hesitated, that's precisely the skill worth building next.
Try it from the lesson
Can you spot the next move?
It's been blowing a strong onshore wind all day, and the barometer has dropped a lot. Should you trust the tide table's predicted height exactly?
Why you can trust this guide
. We build each guide from public seamanship and safety sources, then teach the universal principle before any local difference.