Chart your course
Nautical Chart Symbols Explained

Quick answer
The short version
A chart symbol only tells you what its chart's own legend says it tells you. The master key for U.S. charts is Chart No. 1, a joint NOAA and National Geospatial-Intelligence Agency publication that also reproduces the internationally standardised INT1 symbol set most hydrographic offices use worldwide. Read a symbol in three parts: what shape or letter is printed, what the legend says that shape or letter means, and what the soundings, notes, and currency around it on the chart add to that meaning. A drying rock, a light's flashing rhythm, and a chart correction note are the three symbol types that catch beginners out most often, and each one rewards a slow, deliberate read rather than a guess from memory.
Charts pack an enormous amount of information into a small space, and the only way to do that is with a dense, compact symbol language rather than full sentences. That density is a feature once you know how to unlock it, and a hazard if you don't. A misread symbol beside a genuine hazard, a drying rock mistaken for open water, or a light mistimed and misidentified, can put a boat somewhere it has no business being. The habit that unlocks a chart safely is straightforward: check an unfamiliar mark against the chart's own legend every time, read it together with the soundings and notes around it, and confirm the chart itself is current before you commit to a route, rather than trying to memorise every symbol a chart could ever print.
Your chart carries its own dictionary
Every nautical chart prints its symbols against a shared, standardised system, but the definitive key to that system is a separate publication, not something stored in your head. In the United States, that publication is Chart No. 1, produced jointly by NOAA and the National Geospatial-Intelligence Agency. It runs to more than a hundred pages and shows two related things side by side: the symbols used on paper charts, and the symbol set used to portray NOAA's electronic navigational charts on an electronic chart display. It also reproduces the INT1 symbol set the International Hydrographic Organization sets out for international charts, so the same reference explains a national chart and much of what you will see on another country's hydrographic chart too.
When a mark on the chart in front of you doesn't match anything you recognise, open Chart No. 1, or the printed legend panel on a paper chart, find the matching symbol, and read exactly what it says, rather than guessing from its rough shape. A five-minute check against the actual legend beats a confident guess every time, because chart symbols pack real distinctions, a rock that dries versus a rock that never uncovers, for example, into differences a rough glance can miss entirely.
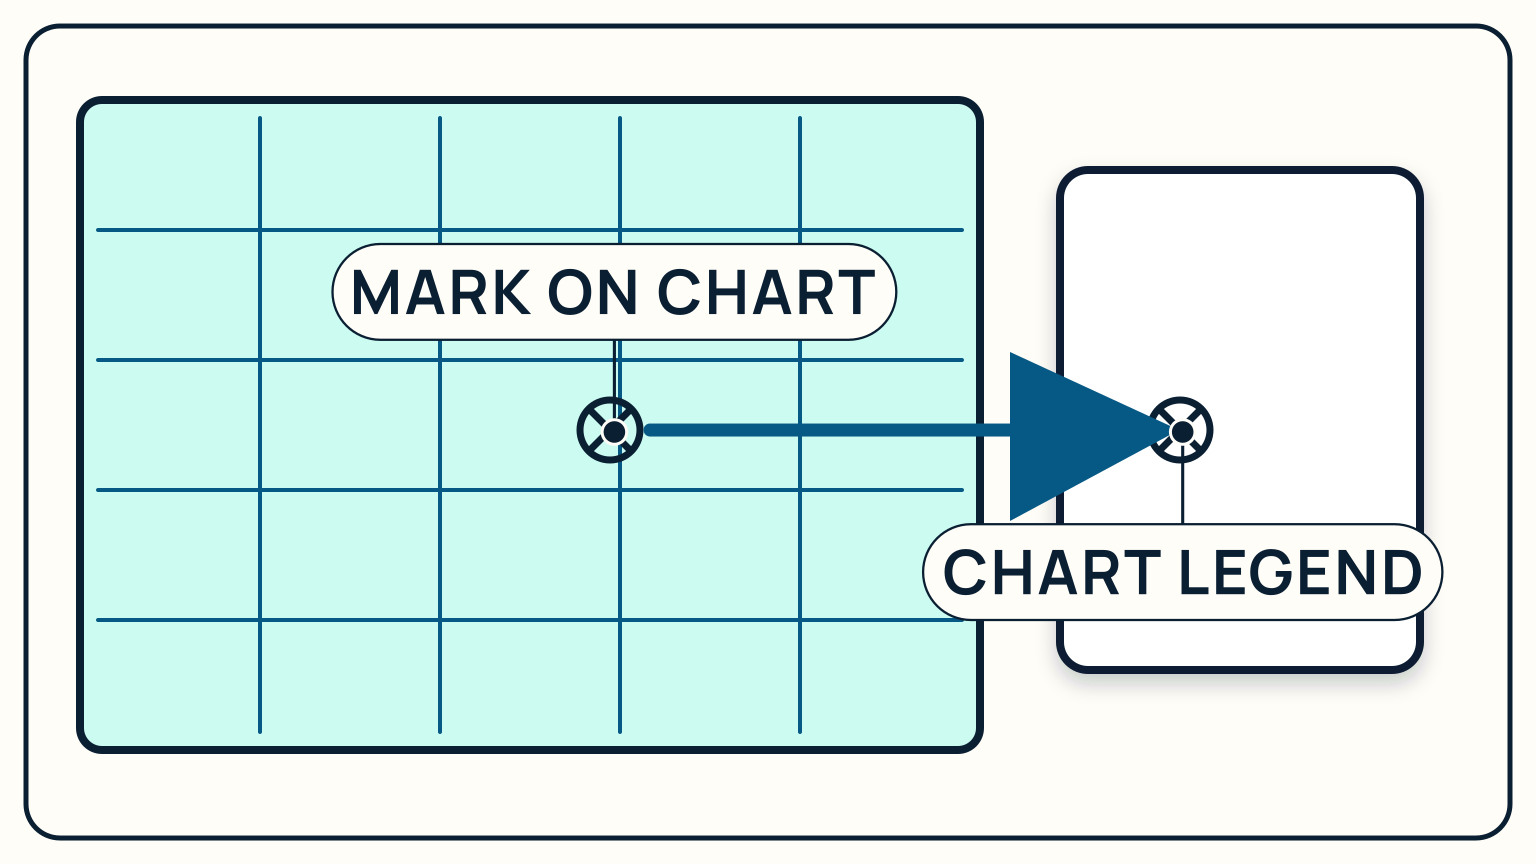
Match the mark before you trust it
Reading a symbol well means reading three things together: the mark itself, its written meaning in the legend, and the information printed right around it on the chart. A number scattered across open water is a sounding, a depth measurement. Those depths, along with any drying height, are measured from a stated chart datum, a reference water level the hydrographic office chooses. NOAA's own chart datum is mean lower low water, the average of the lower low water height of each tidal day measured over a long reference period. Two different charts can use two different datums, so the chart's title block, not habit from your last trip, tells you which one applies here.
Depth contour lines connect points of equal depth into a shape you can read at a glance, and a small letter or abbreviation next to a sounding tells you what the seabed is made of, useful for judging where an anchor will hold. Soundings themselves are printed in feet, metres, or fathoms depending on the chart, and the title block states which; carrying an assumption from your last chart onto a new one is an easy way to misjudge a depth by a wide margin. None of this replaces the legend; it works alongside it. Match a mark you don't recognise to its legend entry the same deliberate way every time, and the habit becomes fast.
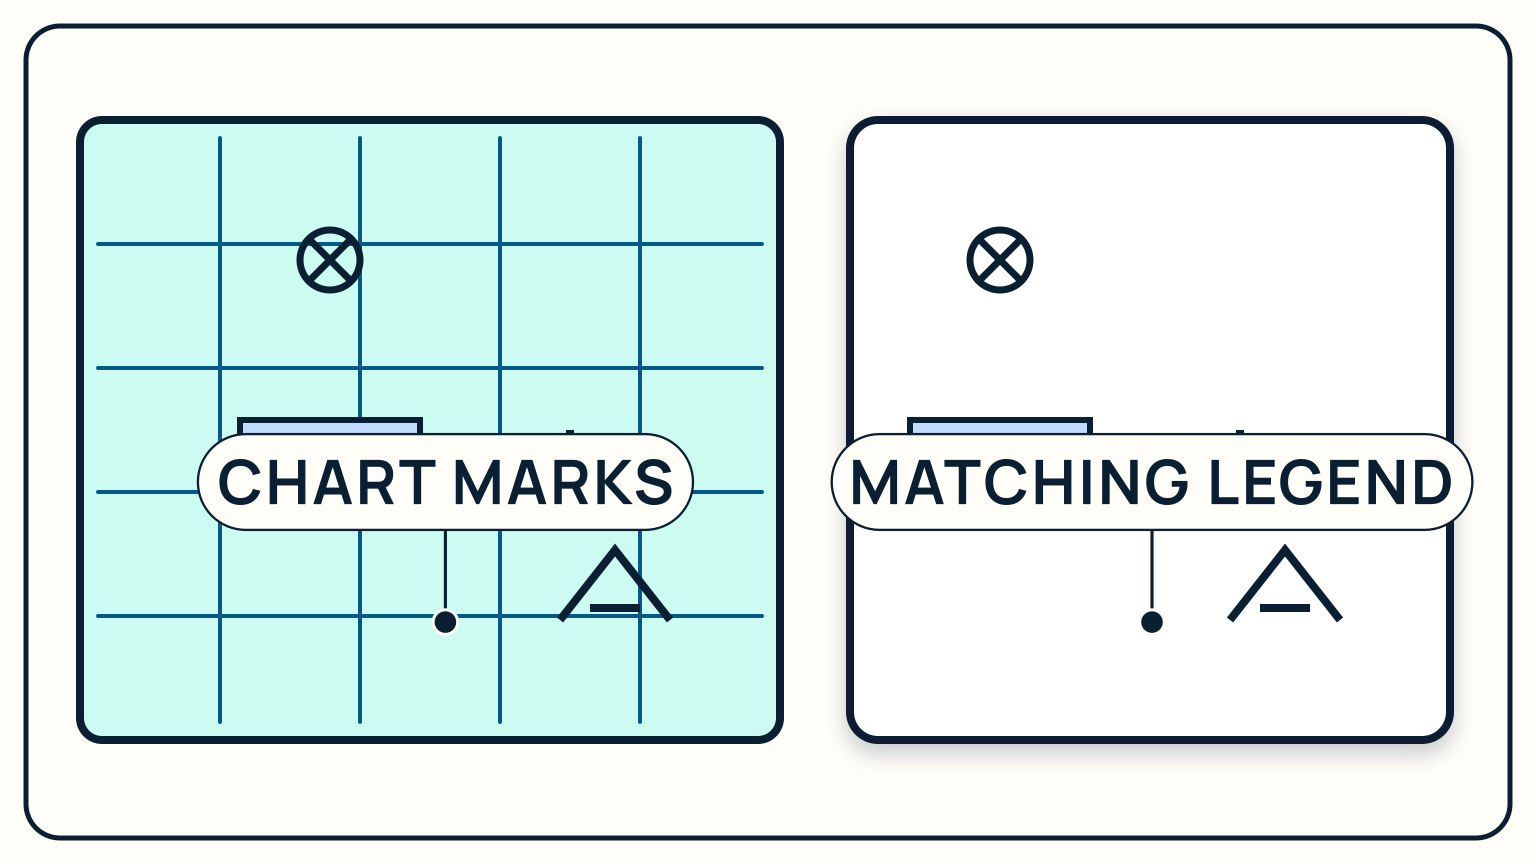
Drying rocks: a danger that comes and goes
Some of the most consequential symbols on a chart describe rocks, because a rock's danger changes with the tide. A drying rock is one that shows above the surface at low water and disappears beneath it as the tide rises. On the chart, it's marked with an asterisk, and when its height is known, an underlined number in parentheses sits beside it. That number is the rock's height above chart datum: at datum-level water its top stands that far above the surface, and it goes under again once the tide rises past that height.
Route planning around a drying rock means asking a specific question: what will the water level actually be when you pass this point? A rock that's obviously exposed two hours before low water can be invisible and dangerous two hours after high water. Pause on any route that crosses near a charted rock symbol, check its exact meaning in the legend, and cross-reference the tide prediction for the time you expect to be there, not the time you're planning the route.
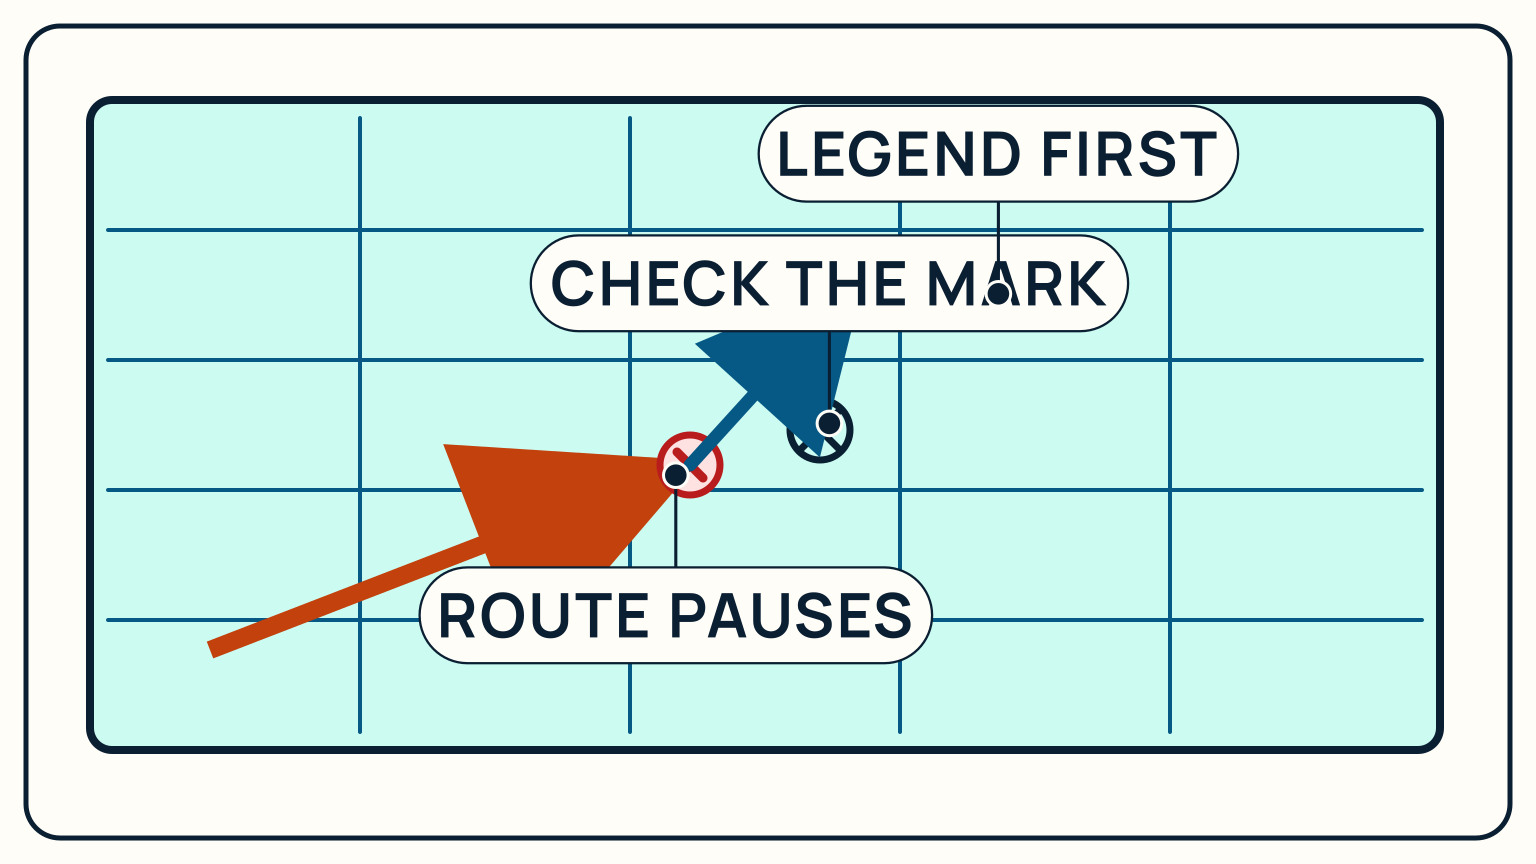
Rock awash, or something else entirely
A drying rock is not the only rock symbol you'll meet, and the differences matter. An isolated asterisk with no drying-height figure marks a rock awash: known to break the surface at some state of tide, but without a charted height for exactly when. Treat it with at least as much caution as a charted drying rock, since you have less information about it, not more. A separate symbol marks a rock that stays submerged even at the lowest charted water level, awash only at chart datum itself rather than truly exposed.
Practise picking these apart on a chart of water you already know before you need to do it under pressure somewhere new. Zoom in on the actual printed mark, hold it next to the matching entry in Chart No. 1 or the legend panel, and say out loud which of the three, drying, awash, or permanently submerged, you are looking at. These symbols are small by design; slowing down to actually read them is the whole skill.
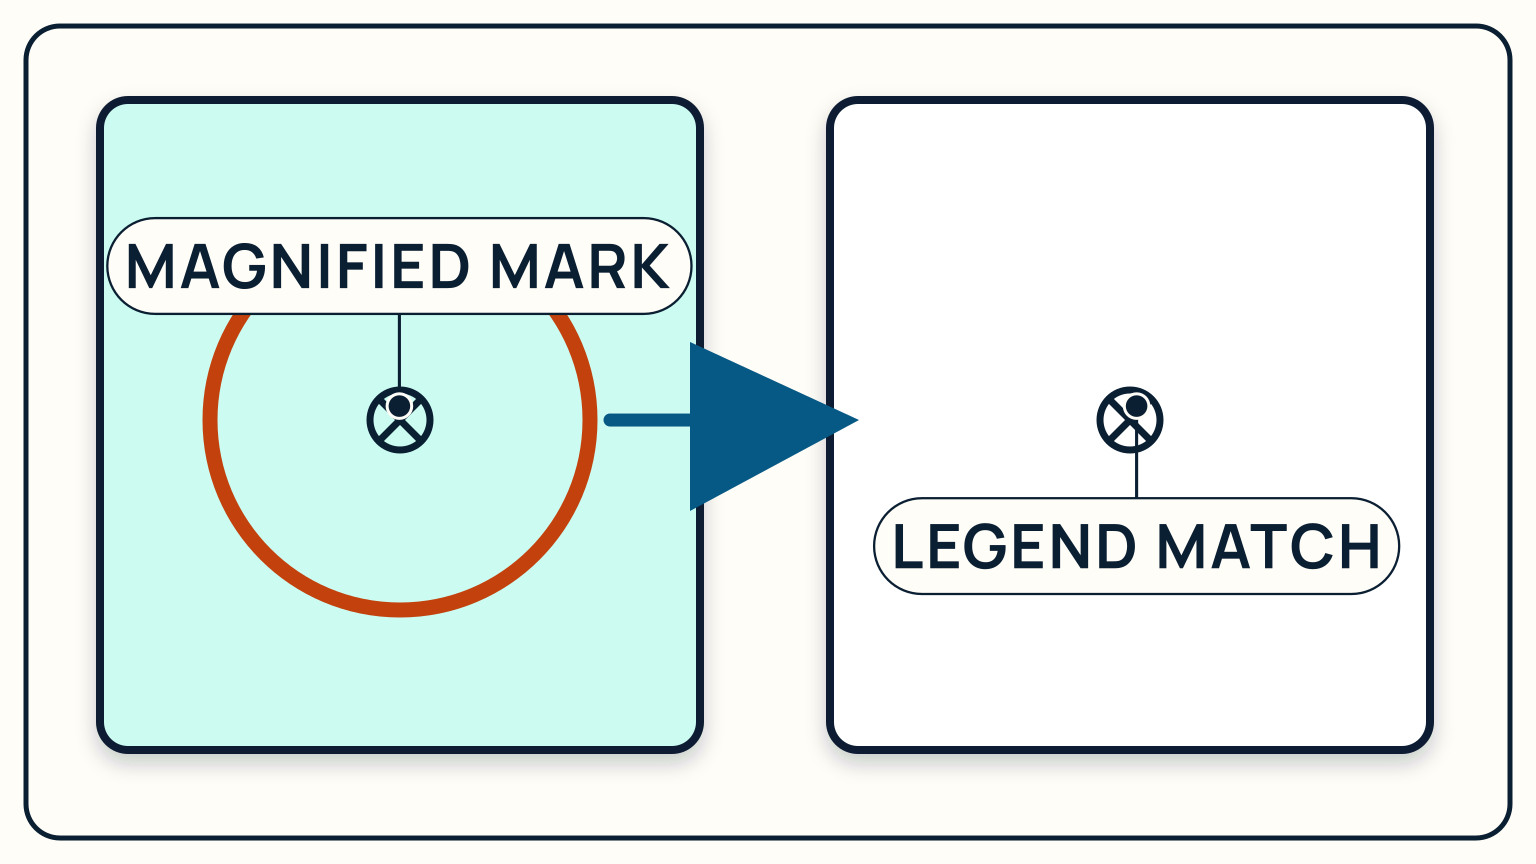
Keep the chart current, and decode a light
A light's rhythm is itself a symbol, written in a condensed code next to the light's position. A notation like Fl(4) WRG 20s 23m 25M packs five facts into one line: it flashes in repeating groups of four, shows white, red, and green sectors depending on your bearing to it, completes its full sequence every 20 seconds, stands 23 metres above sea level, and is visible up to 25 nautical miles in its brightest sector. Standard abbreviations cover the common rhythms: F for a fixed, steady light, Fl for flashing (a short burst of light in a longer dark spell), Oc for occulting (the reverse, long light with a short dark break), Iso for equal light and dark, and Mo for a light that flashes a Morse code letter. Time a light's full sequence with a stopwatch against the charted period before you trust an identification made in the dark.
None of this stays fixed forever. Hydrographic offices classify chart corrections as critical, anything that could pose a danger to navigation, or routine, and distribute critical corrections quickly through numbered update files or a new chart edition. A chart's actual currency depends on the last correction applied to it, not its print date or the day you downloaded it, so checking for updates belongs in the same routine as checking the legend itself. If you haven't worked through a chart's other basics yet, from the title block to plotting a position, how to read a nautical chart covers that ground.
Nautical chart symbols reward patience more than memory. Keep the legend close, check every unfamiliar mark against it, read soundings and notes alongside the symbol rather than in isolation, and confirm the chart's own currency before you commit to a route. That habit turns a chart from a wall of dots and letters into the clearest safety brief you'll get before leaving the dock. SailStarter's Module 10 lessons build exactly this kind of chart literacy in short visual steps, each one ending in a quiz that checks whether the symbol actually stuck before you're relying on it on the water.
Try it from the lesson
Can you spot the next move?
On a NOAA paper chart, you see buff, green, and blue close to shore. What does each colour mean?
Why you can trust this guide
. We build each guide from public seamanship and safety sources, then teach the universal principle before any local difference.